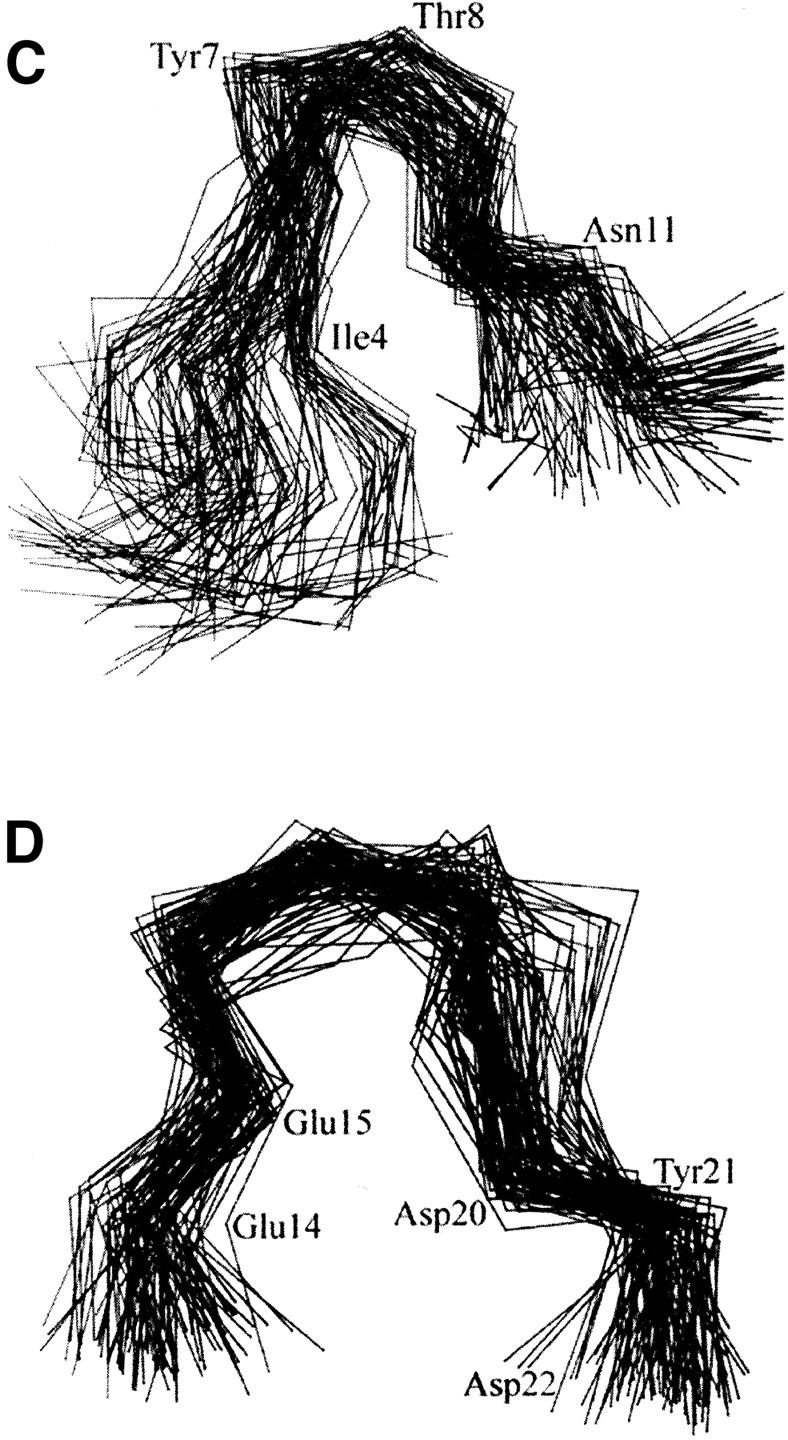
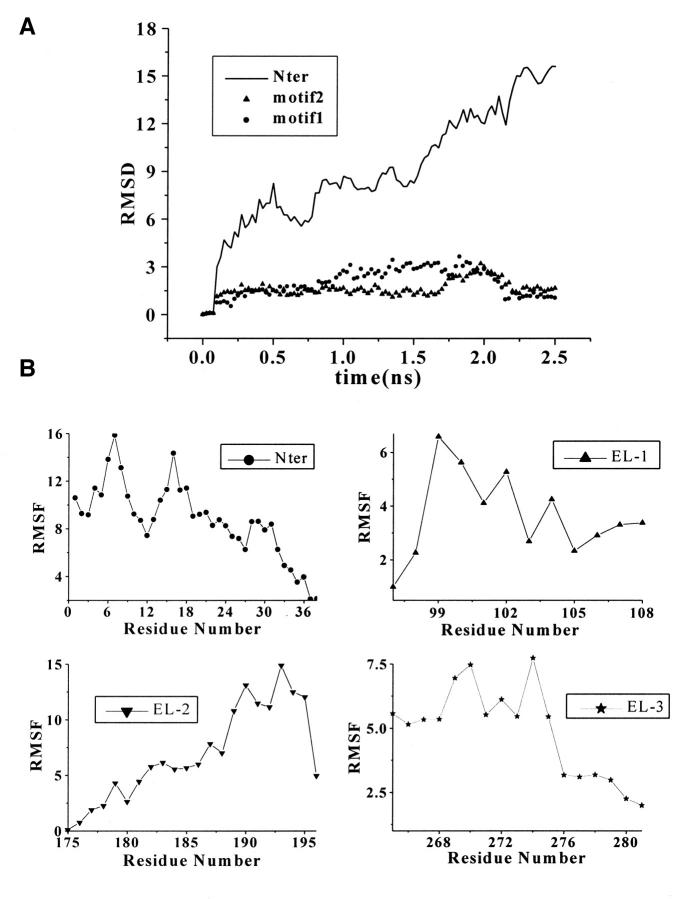
FIGURE 3.

(A) Time evolution of RMSD from initial structure of MD simulations on Nter and two motifs: motif 1, from residue Ile4 to Tyr12 and motif 2, from residue Thr13 to Asp22. (B) The RMS fluctuations of the Nter and three loops (EL-1, EL-2, and EL-3) calculated from trajectories at 300 K. All the values were averaged over individual amino acids. (C) and (D) Stereo view of Cα superposition of conformations from MD snapshots every 50 ps for motif 1 (C) and motif 2 (D) at Nter.

