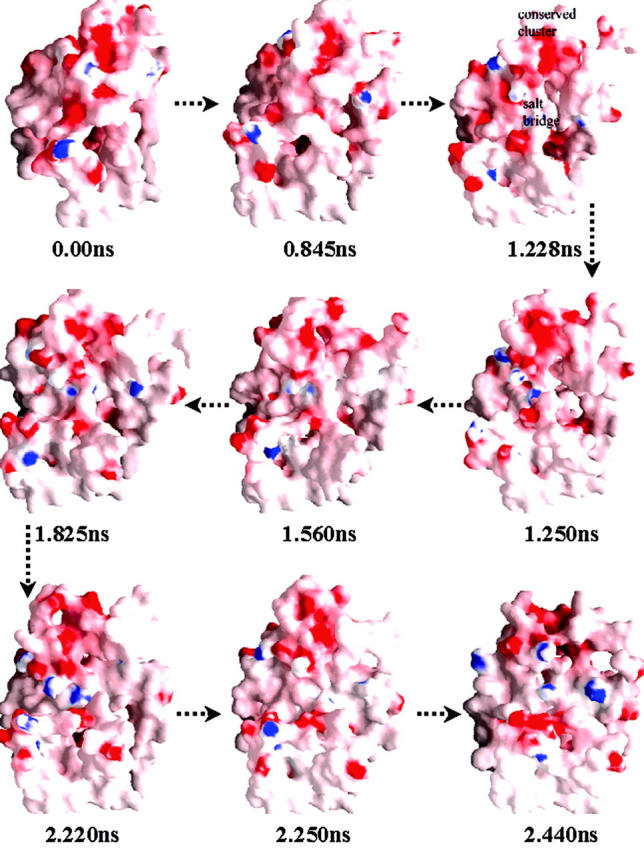
FIGURE 4.

The energy-minima conformations (corresponding to dotted lines in Fig. 2) representing “opening” and “closing” of the binding site at ED-CXCR4. All conformations are shown in the style of molecular surface colored by its electrostatic potential (the color from red to blue on the color panel, which shows the electrostatic potential from negative to positive, numerically represents the range from −10.5 to +10.5). Most part of the TMs is not shown for visual clearance of ED-CXCR4. This figure was generated by using the GRASP (Nicholls et al., 1991) program.
