
FIGURE 6.
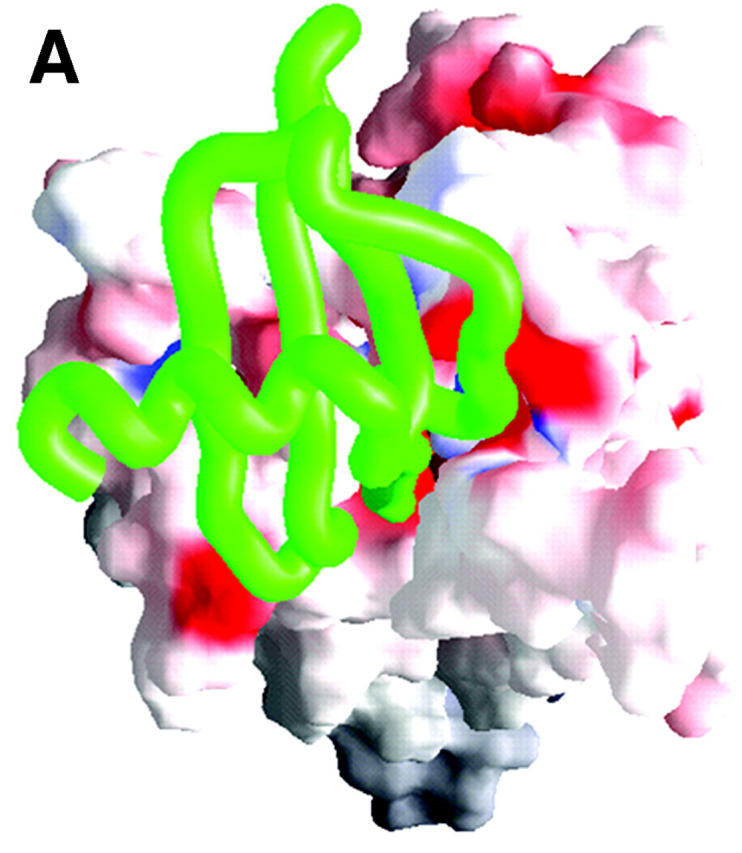
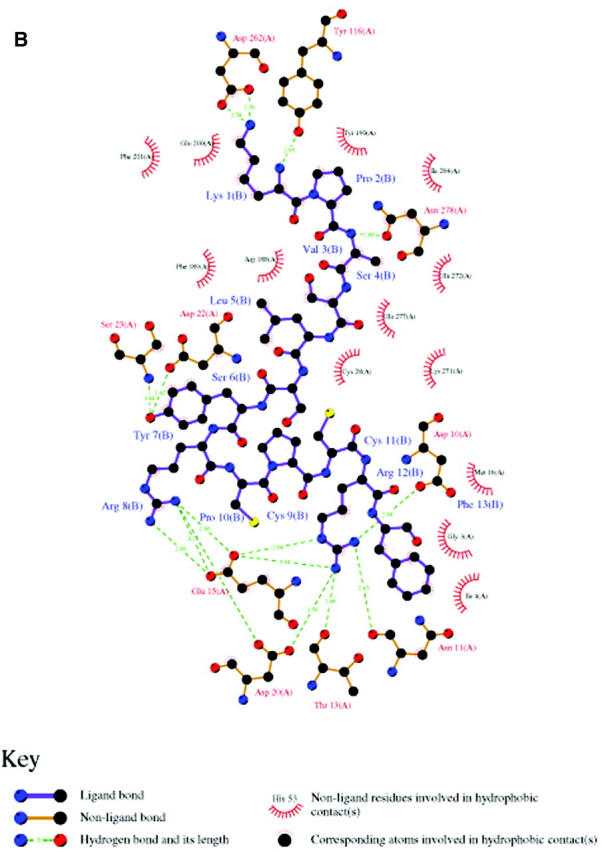
(A) A typical final complex of SDF-1α—CXCR4. CXCR4 is represented as a molecular surface colored by electrostatic potential (the range of the color panel is the same as that in Fig. 4), and SDF-1α as a green worm-like structure. (B) Schematic depiction (generated by using LIGPLOT program; see Wallace et al., 1995) of main interactions between SDF-1α (only the first 13 residues were included) and CXCR4.