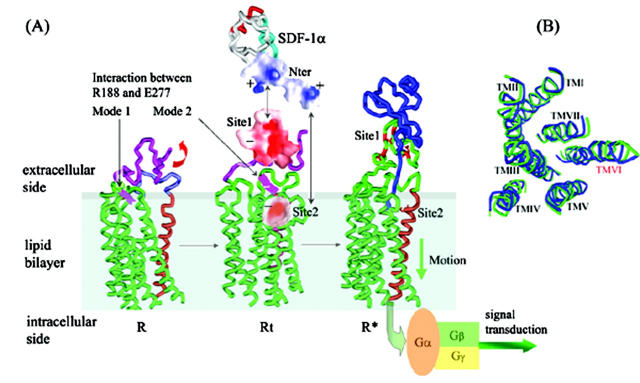
FIGURE 7.
Overall conformational transitions in the process of CXCR4 binding with SDF-1α. (A) CXCR4 changes from its lowest-energy conformation (R) to transition state (Rt). Interaction between the Arg188-Glu277 salt bridge changes from Mode I to Mode II at same time. After recognition of conserved negative-charged cluster (− symbol, in red, Site1 represented as molecular surface; the range of the color panel is the same as that in Fig. 4) at Nter of CXCR4 with positive-charged cluster (+ symbol, molecular surface indicated in blue) at Nter of SDF-1α (shown as black arrow); conformational changes of ED-CXCR4 results in exposure of Site 2 in TMs domain. Thereafter, when SDF-1α—CXCR4 complex is formed, the receptor comes to its active state (R*). (B) Top view of conformation comparison for R (in green) with R* (in blue). TM VI has more significant conformational change while the whole RMSD of Cα of TMs is 0.95.

