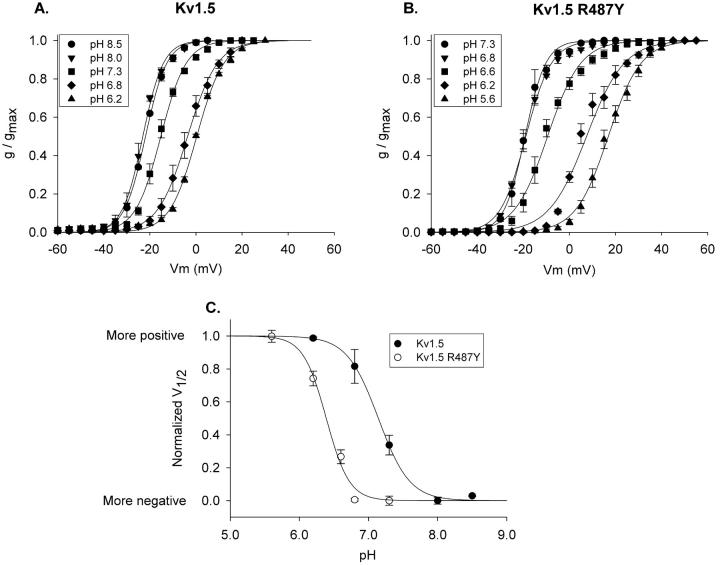
FIGURE 6.
Shift in pK for pH-dependent activation shift with R487Y mutation. (A and B) Activation curves were constructed at the pH values indicated for Kv1.5 and Kv1.5 R487Y, respectively. (C) Plot of membrane potential shift as a function of pH. Activation curves at the two most alkaline pH values for each channel superimposed (see A and B), and were therefore considered to be maximally shifted in the negative direction. To fit the data with a Law of Mass Action function, each V1/2 value, for each channel, was offset identically in the positive direction, so that all V1/2 values were greater than or equal to 0 (the most negative V1/2 value became 0). Values for V1/2max and n were then found by best fit to the equation, F = (V1/2max* xn)/pKn + xn), where V1/2max is the maximum positive shift (in mV) in the curve, n is the slope of the curve, and pK is the pH at which the V1/2 was shifted by 50% of maximum. Data were then normalized to the best fit V1/2max values for each individual plot. Calculated pK values: 7.15 (Kv1.5) and 6.39 (Kv1.5 R487Y). Best fit values for n were 2 and 2.6, respectively. However, reasonably good fits could be obtained with n values ranging from 2 to 4. The calculated pK values were essentially unaffected when fits were constrained to n = 4 [pK = 7.22 (Kv1.5) and 6.39 (Kv1.5 R487Y)].

