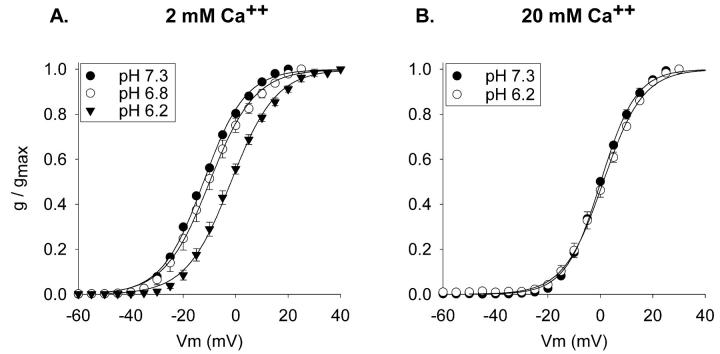
FIGURE 8.
Acidification-induced activation shifts in Kv2.1. (A) Activation curves produced in 2 mM Ca2+. V1/2 values: −12.2 ± 0.1 (pH 7.3, n = 3), −10.0 ± 1.7 (pH 6.8, n = 3), −1.8 ± 1.0 (pH 6.2, n = 3). V1/2 values at pH 7.3 and 6.8 were not statistically different (p < 0.29). (B) Activation curves produced in 20 mM Ca2+. V1/2 values: 0.1 ± 0.4 mV (pH 7.3, n = 4), 1.1 ± 0.8 (pH 6.2, n = 4). All recordings were made in 0 mM external K+.

