FIGURE 4.
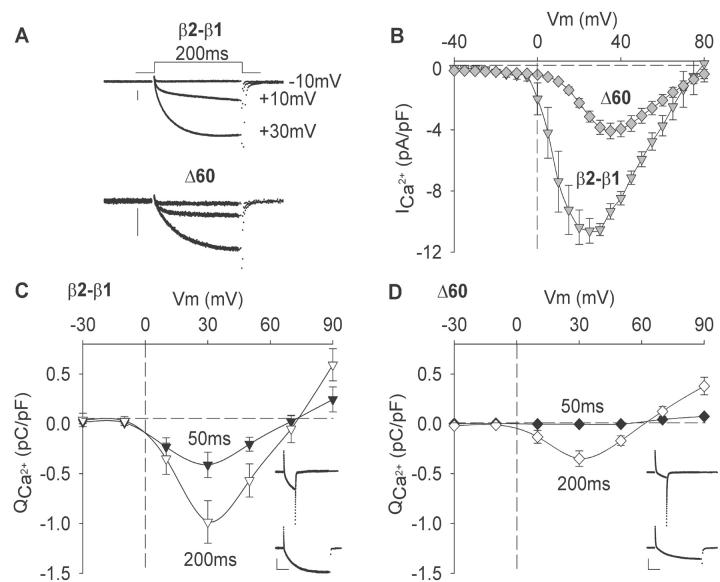
Voltage dependence of Ca2+ currents and Ca2+ entry in myotubes expressing β2-β1 and Δ60. (A) Representative Ca2+ currents in β1 KO myotubes expressing the control chimera or Δ60. Cells were depolarized for 200 ms to the indicated potentials from a holding potential of −40 mV. The vertical scale bar is 0.5 nA in both cases. (B) Peak Ca2+ current versus voltage relationship in response to a 500-ms depolarization from a holding potential of −40 mV. (C, D) The voltage dependence of the ionic charge entering the cell calculated by integration of the Ca2+ current during pulses of 50 ms (filled symbols) or 200 ms (open symbols) from a holding potential of −40 mV. Inserts show representative Ca2+ currents in β1 KO myotubes expressing β2-β1 (225 pF) or Δ60 (300 pF). Scale bars are 0.5 nA (vertical) and 50 ms (horizontal) in both cases. Cells were depolarized from −40 mV to +30 mV.

