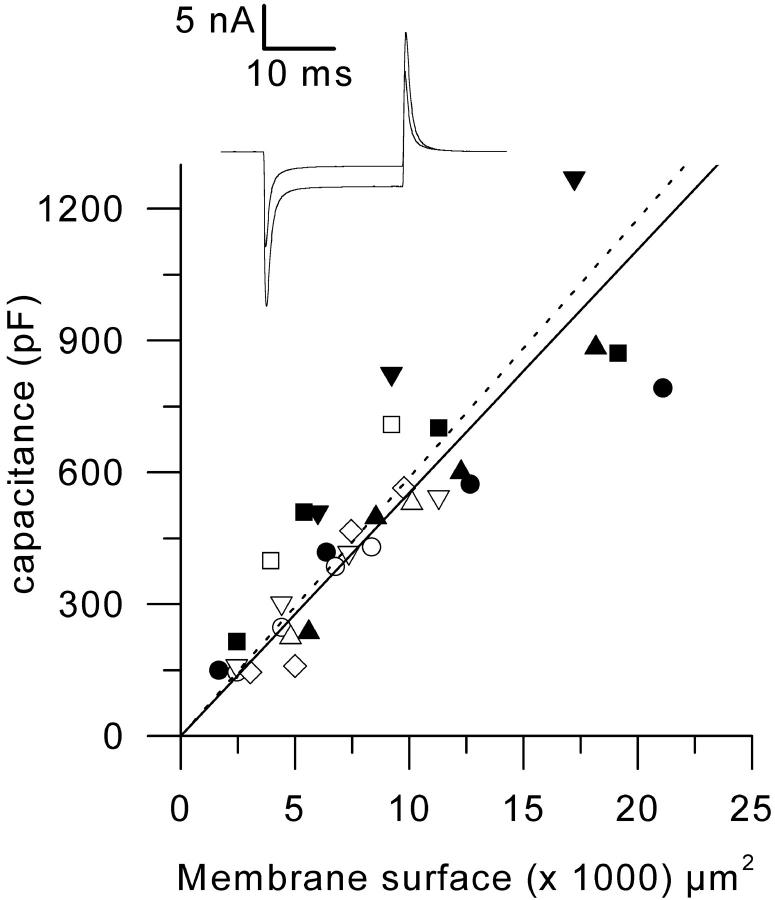
FIGURE 1.
Dependence of the membrane capacitance upon the estimated surface membrane area in four control fibers (solid symbols) and in five mdx fibers (open symbols). Each symbol corresponds to a different fiber. Superimposed continuous and dashed lines correspond to the mean slope obtained from individual fits to data from control and mdx fibers, respectively. Inset shows an example of changes in membrane current elicited by a 20-mV hyperpolarizing pulse at two different lengths of silicone-free portion of the same control fiber: corresponding estimated membrane surface area and measured capacitance were 19,000 μm2 and 820 pF, and 5400 μm2 and 510 pF, respectively.

