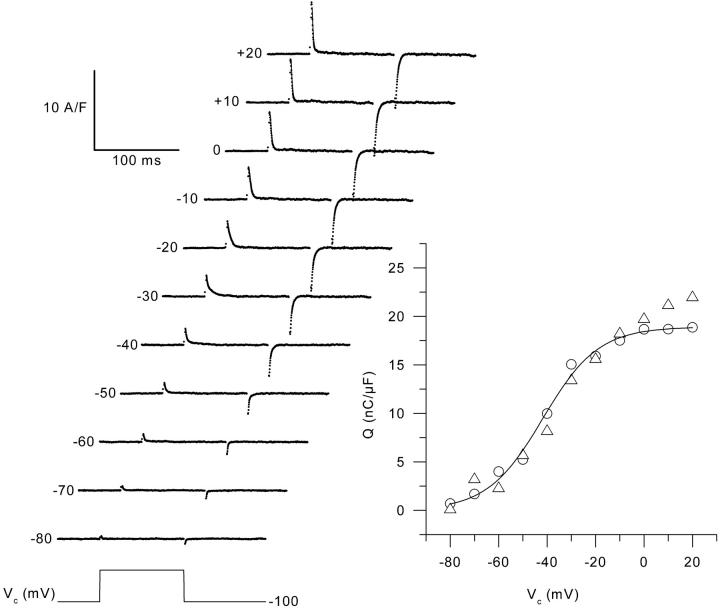
FIGURE 3.
Charge movement records from an mdx muscle fiber in response to 100-ms-long depolarizing command pulses from a holding command potential of −100 mV to the indicated values. The solid lines superimposed on the decay of the “on” charge correspond to the results from fitting a single exponential function. For depolarizations between −80 mV to +20 mV, values for the time constant of decay were 0.8, 1.2, 1.4, 2, 2.4, 5.1, 3.7, 2.6, 1.8, 1.5, and 1.4 ms, respectively. The graph shows the steady-state voltage distribution of the “on” (open circles) and “off” (open triangles) charge, calculated from the records shown on the left. The solid line corresponds to the result from fitting the two-state Boltzmann distribution to the “on” charge data points.

