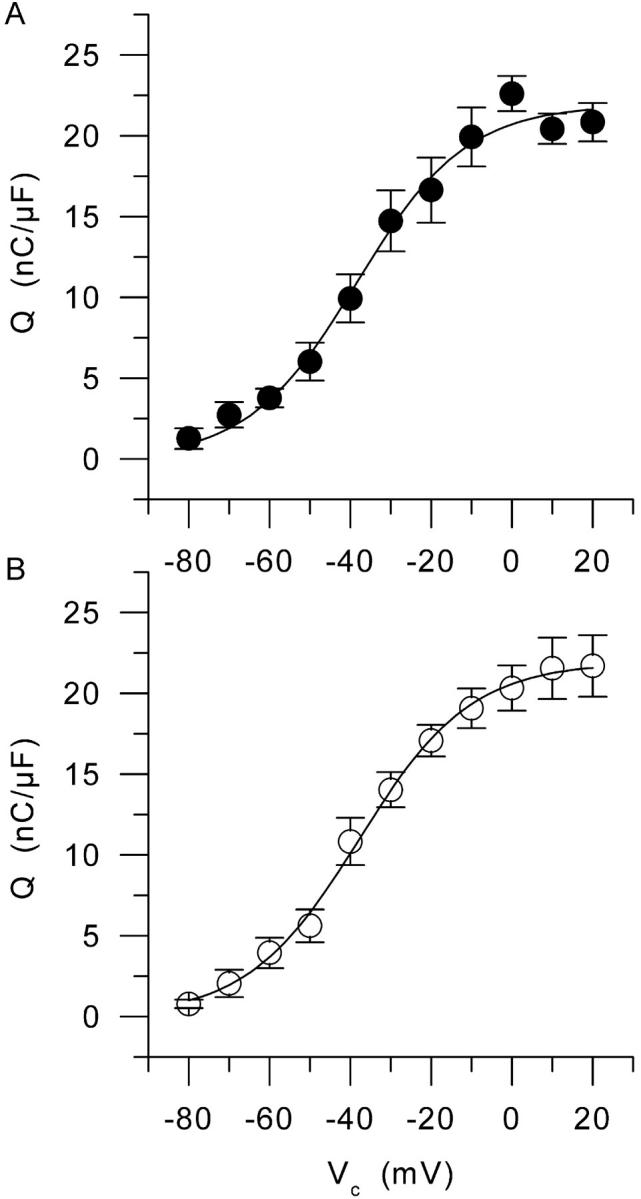
FIGURE 4.

Mean voltage distribution of the “on” charge from (A) seven control fibers and (B) nine mdx muscle fibers. Superimposed solid lines correspond to the result from fitting the two-state Boltzmann distribution to the mean data points. In control and in mdx, this gave values for Qmax, V0.5, and k of 21.9 nC/μF, −38 mV, and 13.5 mV, and 21.9 nC/μF, −38 mV, and 13.8 mV, respectively.
