
FIGURE 5.
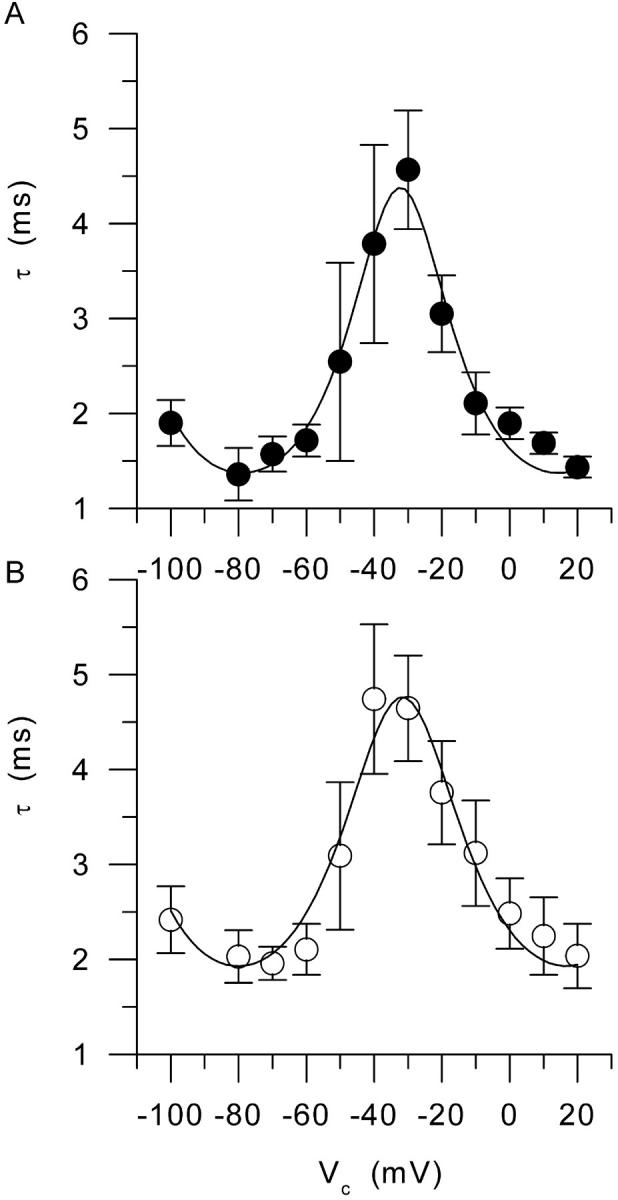
Voltage dependence of the time constant of charge movement decay in (A) control and (B) mdx fibers. In each graph, the superimposed line corresponds to the result from fitting the one-barrier Eyring rate model to the mean values (see text for details).