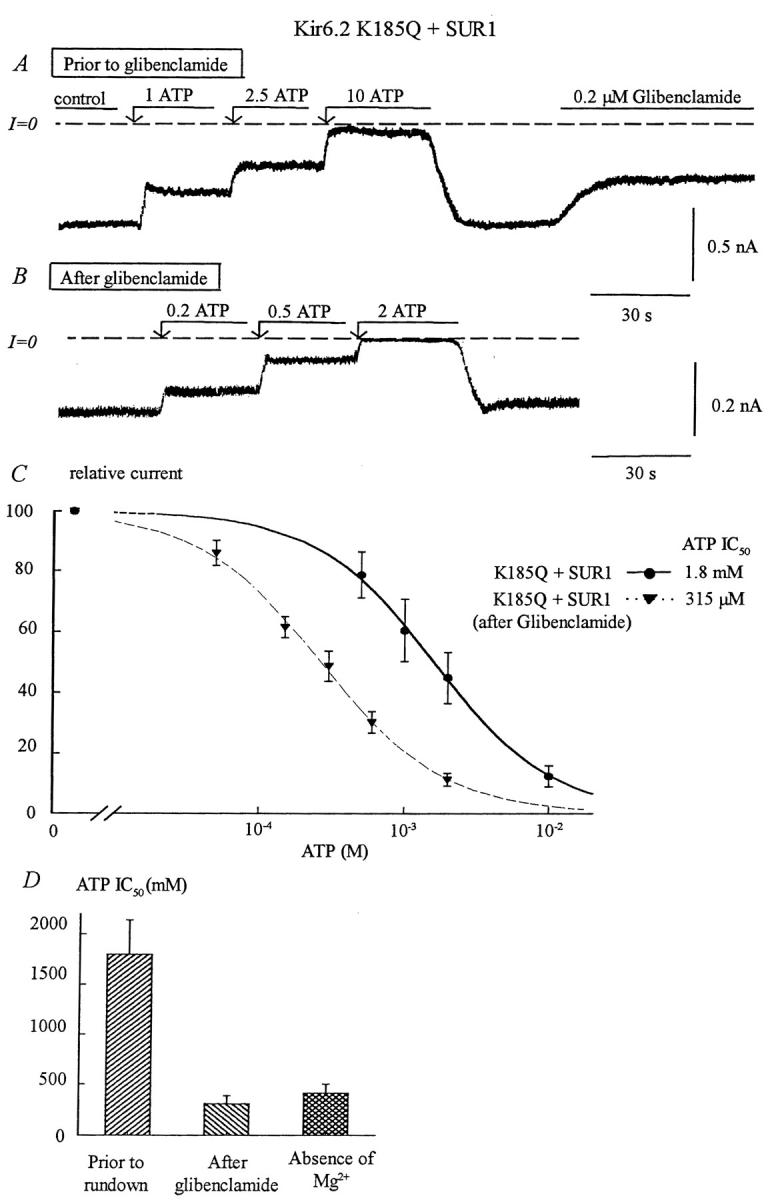
FIGURE 6.

Effects of glibenclamide and rundown on ATP sensitivity of the Kir6.2 mutant K185Q + SUR1. (A) ATP sensitivity in an inside-out patch with K185Q + SUR1. Inward currents were progressively suppressed by increasing ATP concentrations, with the IC50 near 1.8 mM. Glibenclamide (0.2 μM) was then added after removal of ATP. In this series of experiments, patches with low ATP sensitivity were selected to better show the effect of glibenclamide on ATP sensitivity. (B) After glibenclamide the ATP sensitivity increased, the IC50 for inhibition by ATP shifted from 1.8 mM, before glibenclamide, to near 300 μM after glibenclamide. (C) Plot of channel ATP sensitivity for Kir6.2K185Q + SUR1 before (•) and after (▾) glibenclamide. In this case, fit of the data points yielded k = 1.8 mM and n = 1.15 before glibenclamide (n = 5) and k = 315 μM and n = 1.05 after glibenclamide (n = 5). (D) Shows average IC50 values before and after glibenclamide and compares the latter with values obtained after prolonged channel rundown. This graph indicates that glibenclamide and rundown cause similar increases in ATP sensitivity.
