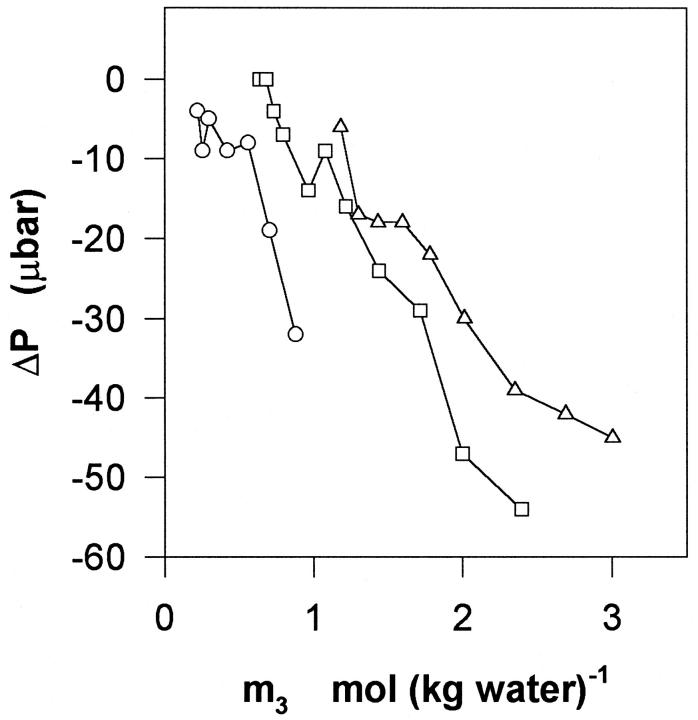
FIGURE 1.
Raw data from the vapor pressure measurements. The graph shows the cell-reference pressure difference, ΔP, as a function of the concentration of glycerol in moles (kg water)−1. Negative values of ΔP show that the presence of DMPC vesicles in the cell reduces the chemical potential of water. The glycerol:DMPC mole ratio for the three trials was respectively 2.79 (circles), 9.08 (squares), and 16.28 (triangles). The experimental reproducibility was ±4 μbar.

