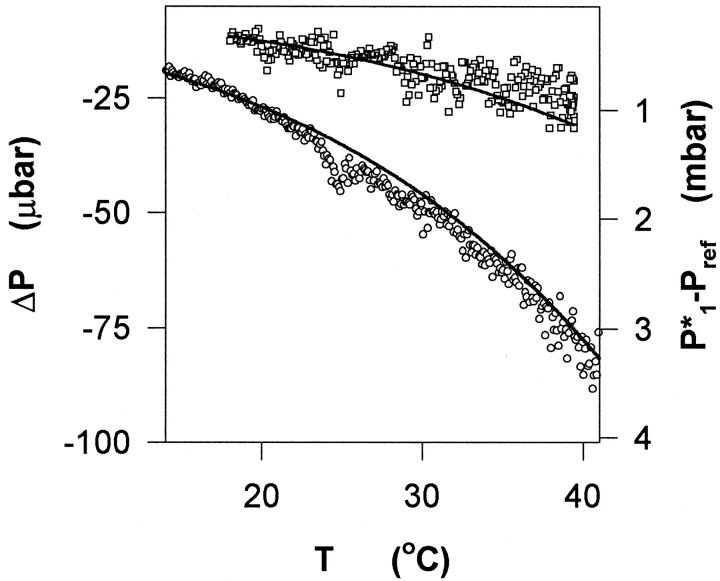
FIGURE 4.
Vapor pressure measurements showing the cell-reference pressure difference, ΔP (left ordinate), as a function of temperature. The two trials represent different compositions. For the lower dataset (circles) the concentrations of respectively glycerol and DMPC were 2.393 and 0.263 mol (kg water)−1, whereas for the upper curve (squares) the concentrations were 0.880 and 0.315 mol (kg water)−1. Also shown in the figure is the vapor pressure lowering of the reference, P1*−Pref (solid line, right ordinate). The accordance between the two sets of functions shows that the effect of the lipid, ΔP, is proportional to the vapor pressure lowering, and hence, as discussed in the text, that the net glycerol–DMPC interaction is fairly insensitive to temperature changes.

