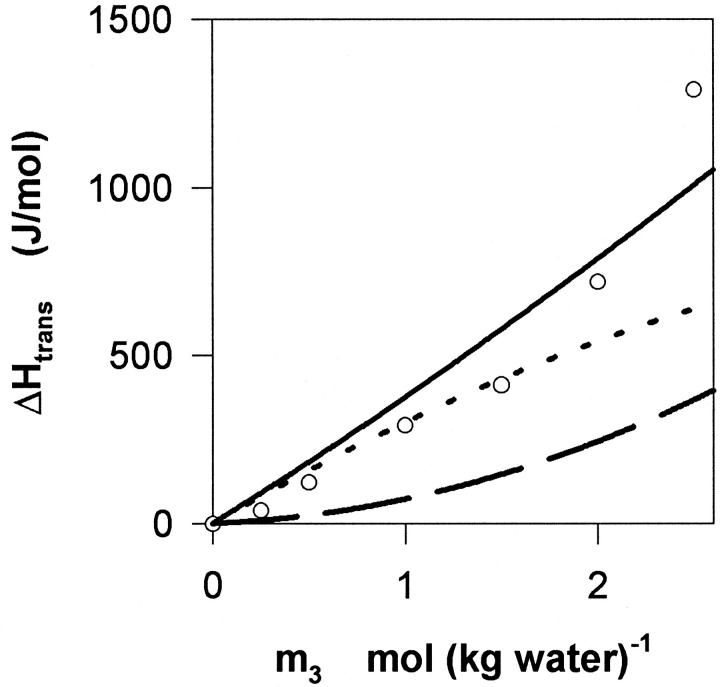
FIGURE 8.
Thermochemistry of the transfer of DMPC vesicles from water to aqueous glycerol. The circles show experimental results at 30°C. The dotted line indicate the enthalpy contribution arising from the partitioning of glycerol into the membrane (ΔHtrans(i)), defined in the main text) and the dashed line quantifies effects due to preferential interactions at the membrane-solvent interface (ΔHtrans(ii)). The solid line indicates the sum ΔHtrans(i) + (ΔHtrans(ii)). The figure suggests that enthalpic effects due to local changes in composition described in the discussion accounts rather well for the measured heat of transfer. Also it appears that process i dominates the measured ΔHtrans and low concentrations, inasmuch as ii becomes increasingly important with increasing m3.

