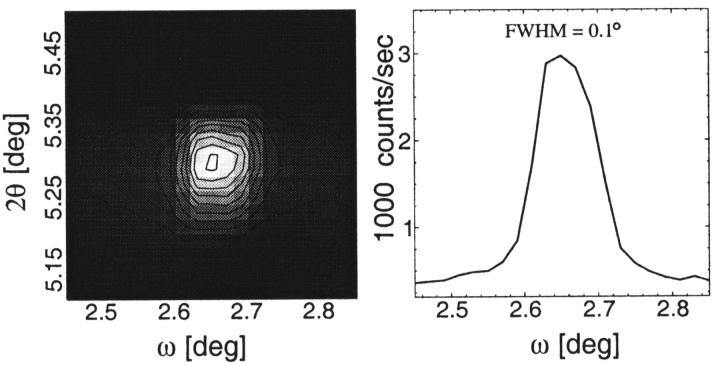
FIGURE 2.
(Left) A representative two-dimensional ω−θ scan around the third Bragg peak of an aligned multilayer sample of WALP13 in DMPC bilayers (P/L = 1/20). The sample was well aligned and showed a single peak on a flat background. (Right) A cut through the center of the peak at constant θ corresponds to the ω rocking curve. The FWHM of the rocking curve is 0.1°, the same as the limiting resolution of the apparatus. The background below the Gaussian fit to the rocking curve is negligible, implying very little powder diffraction.

