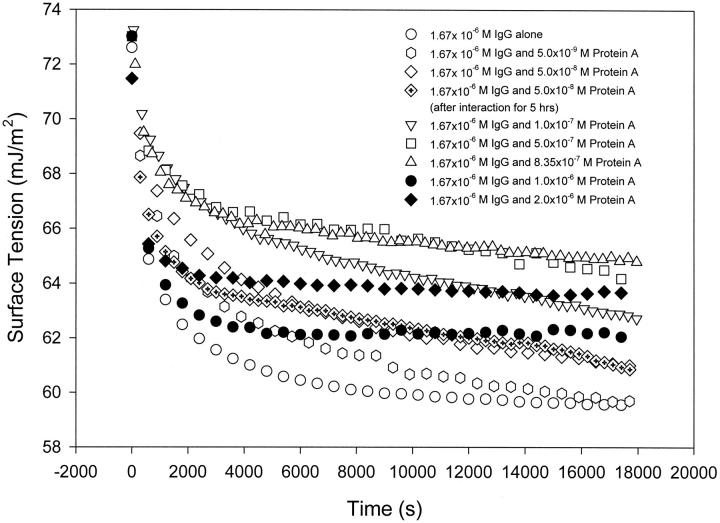
FIGURE 5.
Dynamic surface tensions of the mixture of IgG and Protein A solutions. In the mixture, the concentration of IgG is fixed at 1.67 × 10⁻⁶ M, and the concentration of Protein A is 5.0 × 10⁻³ , 0.05, 0.10, 0.50, 0.835, 1.0, and 2.0 μM, which correspond to molar ratios of Protein A to IgG at 1:334, 1:33.4, 1:16.7, 1:3.34, 1:2, 1:1.67, and 1:0.835, respectively. The dynamic surface tension measurements started immediately after mixing, and experimental duration was 5 h. It is noted that the highest surface tension is observed at the molar ratio of Protein A to IgG of ∼1:2.

