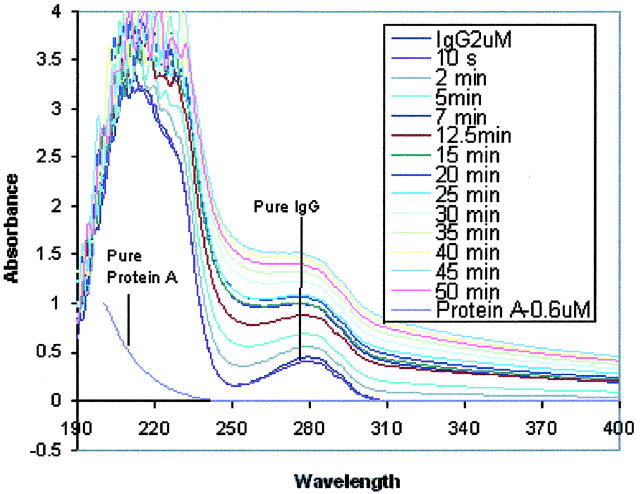
FIGURE 8.
The change in UV absorption of IgG and Protein A solutions due to molecular interactions with each other. The absorbances of both pure Protein A (0.2 μM) and IgG (2 μM) solutions were measured in the wavelength range of 190–400 nm. The absorbance change with time of the mixed solution of Protein A with IgG was recorded after adding Protein A solution (0.1 ml, 2 μM) to IgG solution (0.9 ml, 2 μM) in the same wavelength range.

