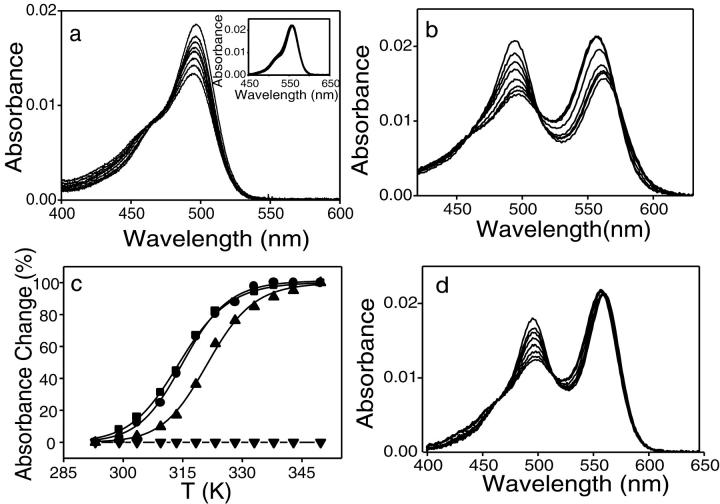
FIGURE 4.
Temperature dependence of the absorbance spectra of the singly and doubly labeled cTAR derivatives. Absorption spectra of cTAR-3′-Fl (a), TMR-5′-cTAR (a, inset), TMR-5′-cTAR-3′-Fl (b), and TMR-5′-cTARC12-3′-Fl (d). The absorption spectra were recorded at 20, 30, 35, 40, 50, 60, 65, and 70°C. (c) Melting curves of TMR-5′-cTAR-3′-Fl. The melting curves are based on the absorbance changes monitored either at the Fl (•) or TMR (▪) peak or at 260 nm (▴). The melting curve of TMR-5′-cTARC12-3′-Fl (▾) is based on the absorbance changes at the Fl peak. The absorbance changes at the Fl peak in doubly labeled derivatives were corrected for the intrinsic sensitivity of Fl to the temperature (as deduced from the cTAR-3′-Fl derivative).

