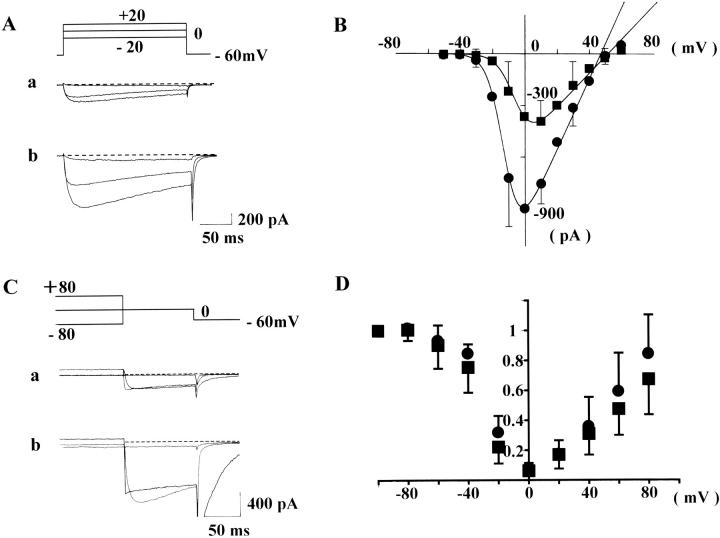
FIGURE 1.
Activation curves (A and B). In the absence (current traces A a and squares in B) and presence of Bay K 8644 (100 nM) (current traces in A b and circles in B), rectangular pulses of various voltages (from −50 to +60 mV, 10-mV steps, 200-ms in duration)) were applied from the holding potential of −60 mV at 30-s intervals. In A, representative current traces, obtained from step pulses of −20, 0, and +20 mV are shown. The series resistance was ∼6–10 MΩ after series resistance compensation by 30–40%. Dotted lines indicate zero current level. In B, the peak amplitude of Ca2+ channel current is plotted against the rectangular pulse potential. Each current amplitude was linearly corrected by assuming the current recorded at −60 mV was only due to leak current. Each symbol in B indicates the mean value obtained from six cells. For clarity, the SD of means is only shown for some of the data points. The data points were fitted with Eqs. 1a and 1b defined in Methods. Fitting parameters are listed in Table 1. Inactivation curves (C and D). In the absence (current traces C a and squares in D) and presence of Bay K 8644 (100 nM) (current traces in C b and circles in D), a test step (0 mV, 100 ms) preceded by conditioning potentials of a wide range (between −100 and +80 mV, 20-mV steps, 4-s in duration) was applied at 60-s intervals. In C, representative test currents, obtained after preconditioning, depolarizations of −80, 0, and +80 mV are shown. Only the last 90 ms of conditioning step is shown. In D, the amplitude of test current relative to that conditioned by −100 mV is plotted against conditioning potentials. Each data point represents the mean value obtained from eight cells. Vertical bars, SD.

