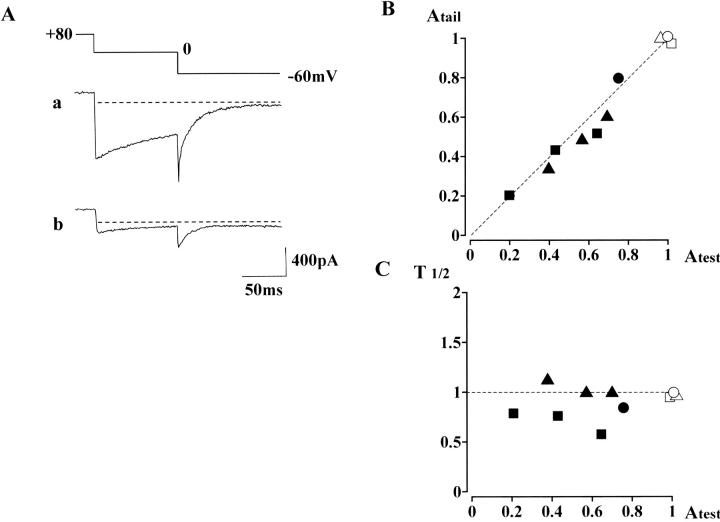
FIGURE 7.
Inhibitory effects of nifedipine on the inward current evoked after large conditioning depolarization in the presence of Bay K 8644. In the presence of the Ca2+ agonist, a preconditioning depolarization (first step: +80 mV, 4 s; second step: 0 mV, 100 ms) was repeated at 60-s intervals. Subsequently, nifedipine was added to the extracellular solution. (A) A control current trace obtained in the presence of 100 nM Bay K 8644 is shown in a, whereas the current trace (b) is obtained 3 min after application of 1 μM nifedipine. (Series resistance, ∼8 MΩ) (B) Correlation between the peak amplitude of the tail current (−60 mV) and the current amplitude at the end of the 0 mV step. The current amplitudes were normalized by each control inward current obtained in the presence of only Bay K 8644. Open symbols correspond to the control data, whereas filled symbols are data obtained in the additional presence of nifedipine. Triangles are the data obtained in the cell shown in A. (The data obtained 1 and 2 min after addition of 1 μM nifedipine are also plotted.) Three filled squares represent the data obtained from another cell in which 1 μM nifedipine was added for 3 min in the presence of 100 nM Bay K 8644; i.e., three current traces were obtained. The filled circle represents a current trace obtained 2 min after addition of 100 nM nifedipine in the presence of 100 nM Bay K 8644. The dotted line in B has a correlation coefficient = 1. In C, the half decay time of the tail current, relative to that of the control value, is plotted against the peak amplitude of the tail current. The dotted line corresponds to the initial time to half decay (T1/2).

