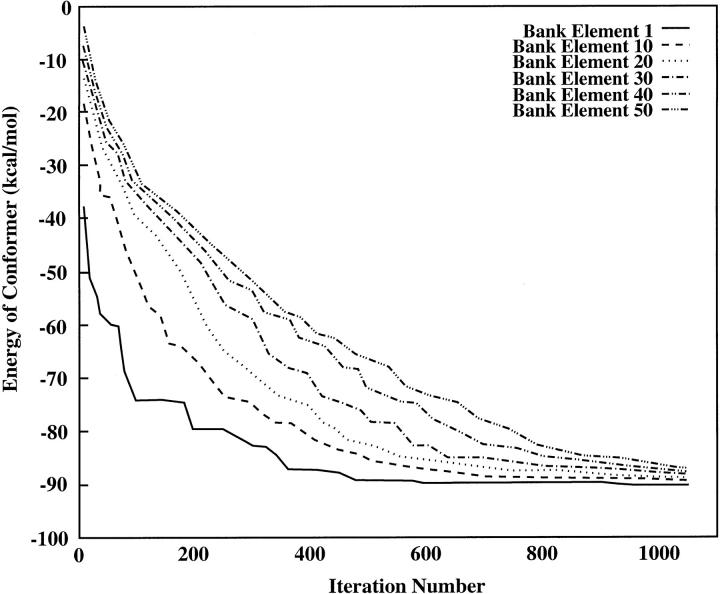
FIGURE 4.
Plot of energies for elements occupying selected positions within CSA bank as a function of iteration. This test run used an alternating hybrid with a linear annealing schedule (Imax = 1,000) and a five-round wait between bank updates. Note that the PEGM was located at iteration 930. No bank size increases occurred during this run.

