FIGURE 3.
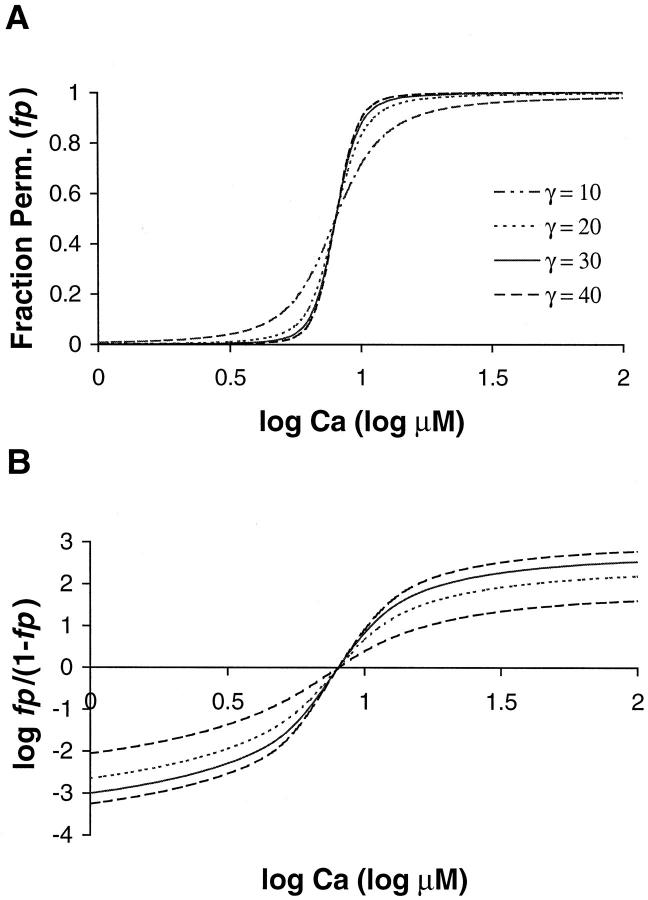
Model results are shown for four values of γ. (A) The fraction of permissive units (fp) is plotted vs. log [Ca]. These plots can be compared to the F-pCa relation in Fig. 1 if one assumes that force is proportional to the fraction of permissive units. The values of γ are 10, 20, 30, and 40 as labeled, whereas the other parameters were fixed (Kd = 10 μM, μ = 15, and Q = 2). As γ increases, the steepness also increases indicating higher apparent cooperativity. (B) Apparent cooperativity is assessed using a Hill plot showing log (fp/(1−fp)) as a function of log [Ca]. The traces are sigmoidal and not linear; hence, the model does not produce true Hill functions. The slope is close to maximal near [Ca50] (corresponding to the zero crossing) and decreases to either side. The NH50 values (the slope at Ca50) point are 4.4 for γ = 10, 7.7 for γ = 20, 9.4 for γ = 30, and 10.3 for γ = 40.

