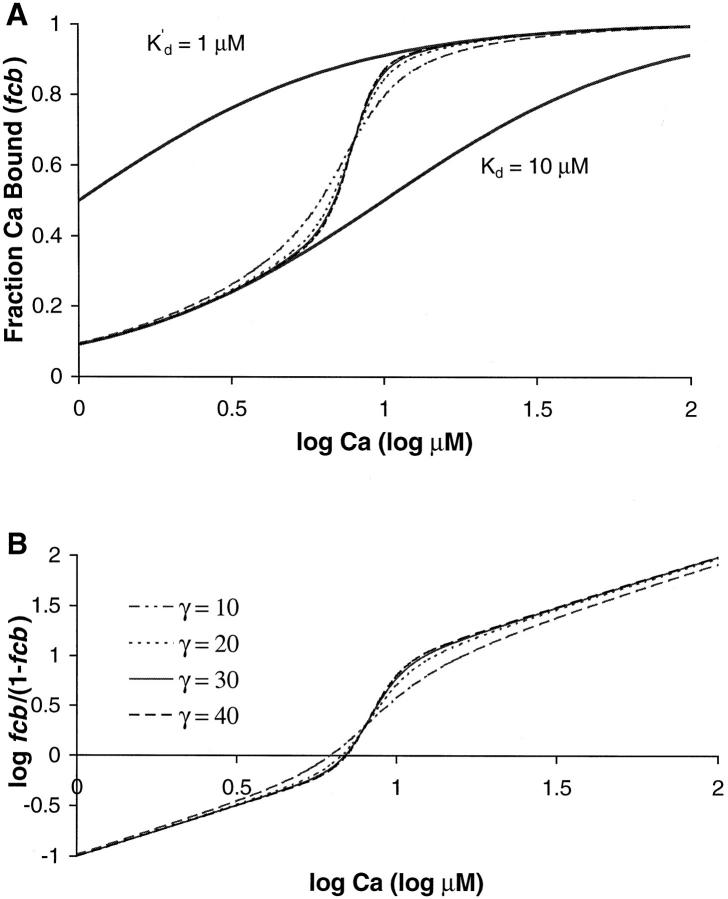
FIGURE 4.
Model results are shown for four values of γ. (A) The fraction of unit with Ca bound (fcb) is plotted vs. log [Ca]. The four data traces are from the same simulation as those in Fig. 3. In the lower [Ca] range, the fcb initially resembles the lower thick trace that shows the Ca binding curve for a simple buffer with a dissociation constant = 10 μM. In the upper [Ca] range, the fcb resembles the upper thick trace that shows the Ca binding curve for a simple buffer with a dissociation constant = 1 μM. The transition between the curves reflects the highly cooperative fp curves shown in Fig. 3. (B) Apparent cooperativity is assessed using a Hill plot showing log (fcb/(1−fcb)) as a function of log [Ca]. The slope is initially 1 reflecting the uncooperative binding at low [Ca]. Near the transition region, the slope gets larger indicating the higher apparent cooperativity near the [Ca50] point. At even larger [Ca], the slope again returns to 1 as the binding again is uncooperative. The slope is largest near [Ca50] point (corresponding to the zero crossing in Fig. 3 B). For the cases shown, the slope is 2.9 for γ = 10, 4.2 for γ = 20, 4.8 for γ = 30, and 5.1 for γ = 40.

