FIGURE 6.

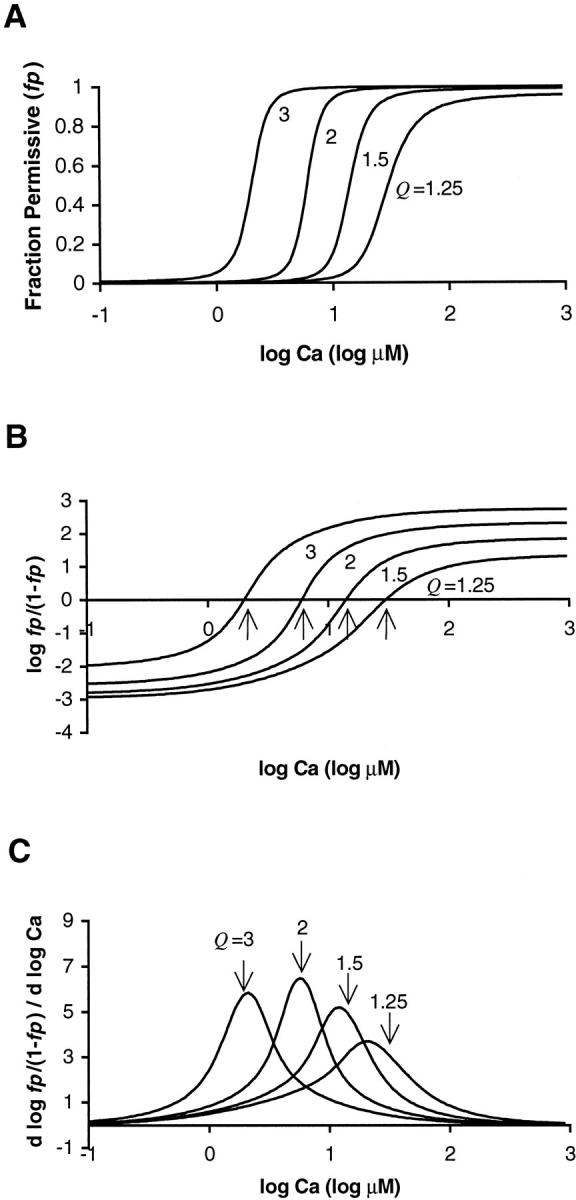
The plots illustrate the effects of variation of parameter Q. (A) fp relations are shown for Q = 1.25, 1.5, 2.0, and 3.0. The other parameters were fixed values (Kd = 10 μM, μ = 5, γ = 20). The parameter Q affects the value of fp at extremely large and small values of [Ca]. With a large value of Q, the plateau fp approach 1 at high, saturating values of [Ca]. (B) Hill plots show log (fp/(1−fp)) plotted as function of log [Ca]. The data are the same as in A. The arrows indicate the zero crossings that correspond to the [Ca50]. (C) Slope of the Hill plots from B is also plotted. The slope reports the apparent cooperativity at different levels of [Ca]. In general larger Q values produce more activation at low [Ca]. The value of parameter Q also affects the symmetry of the fp relations. See that the peaks of the slopes do not always line up with the [Ca50] points, as indicated by the arrows drawn at the same [Ca] as the zero crossings in B. Hence, the NH50 value that reports the Hill coefficient at half activation does not always report the maximum slope of the corresponding Hill plot.
