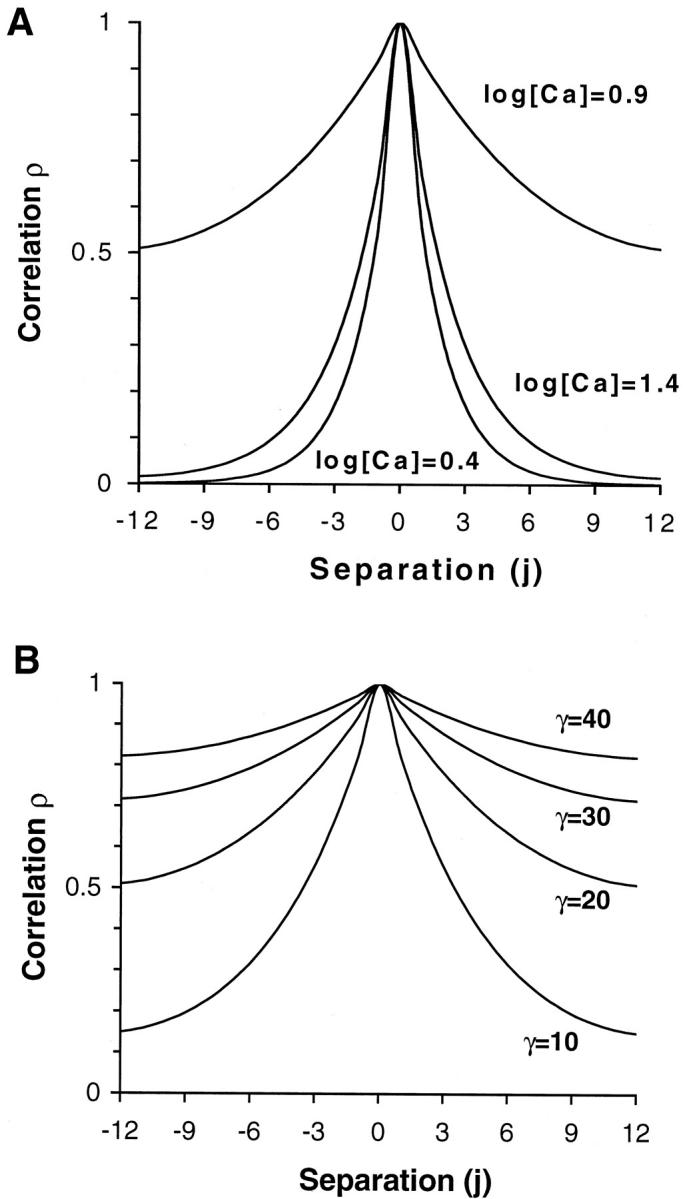
FIGURE 7.

Correlation ρ(i) computed for two sets of parameter variations where i is the number of units from the point of reference. (A) Ca level is set to three fixed values (log ([Ca] / 1 μM) = 0.4, 0.9, and 1.5) whereas other model parameters are fixed (Kd = 10 μM, μ = 15, Q = 2, and γ = 20). The correlation is equal to 1 at i = 0 and decreases in either direction. The correlation falls most rapidly at high or low [Ca] whereas values near Ca50 produced correlation between units for separation as large as 12. (B) The parameter γ is set at four values whereas the parameters are fixed (Kd = 10 μM, μ = 15, Q = 2, and [Ca] = [Ca50]). Near [Ca50], the correlation falls off more slowly as γ is increased. At [Ca] values much smaller or larger than [Ca50] where normalized force is closer to 0 or 1, respectively, the falloff of correlation is not as strongly dependent on γ (data not shown).
