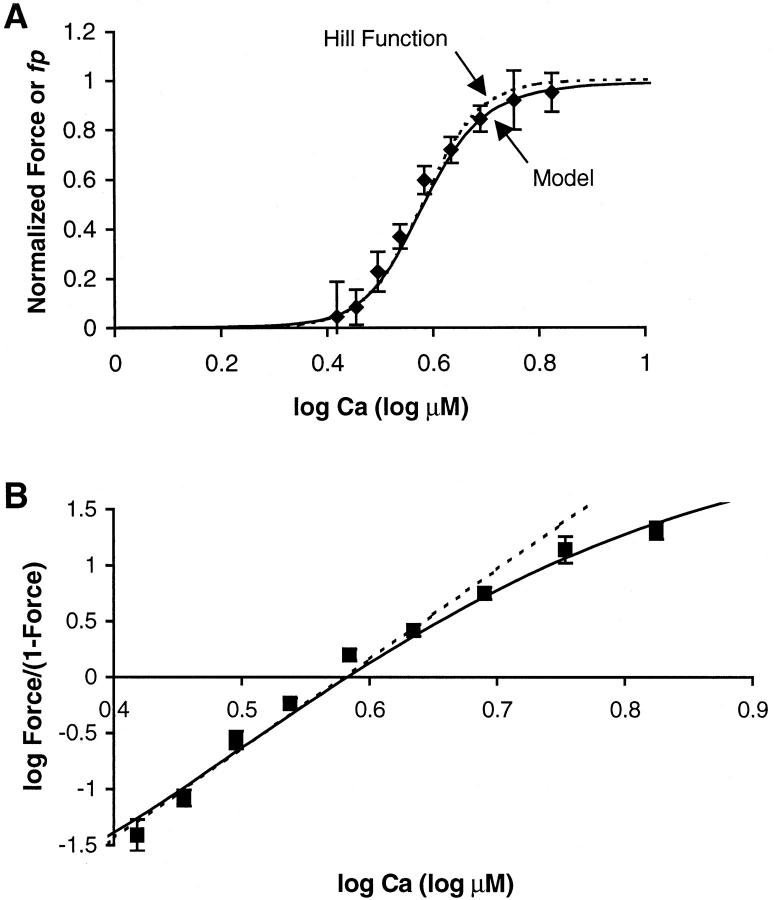
FIGURE 8.
The model is used to fit the experimentally determined F-pCa relation from Fig. 1. (A) The fraction of permissive units (fp, solid trace) from the model is compared to normalized force in the experimental data from Fig. 1. The plot also shows a true Hill function (dashed trace) for comparison. The model results are similar to the Hill function but are lower above Ca50, as is also seen in the experimental data. (B) Data is replotted using Hill plots where both log (fp/(1−fp)) and log (Force/(1−Force)) are plotted as a function of log of activator [Ca] in μM. In the Hill plots, the model results show different slopes above and below Ca50, although the transition is not as sharp as for the experimental data (compare to Fig. 1 B). Moreover, the initial slope below Ca50 is ∼8 for the model, whereas the experimental data can fit with a line with slope = 10. Model parameters are Kd = 2.125, μ = 15, γ = 40, and Q = 1.5. See text for the method of choosing the parameters. Note that the errors bars show the standard error computed after transforming the raw data points individually using log (Force/(1−Force)). Because this transformation is nonlinear, the standard error reported in A may differ from that in B. Hence, the fit to the experimental data may fall within the error bars in A but not B.

