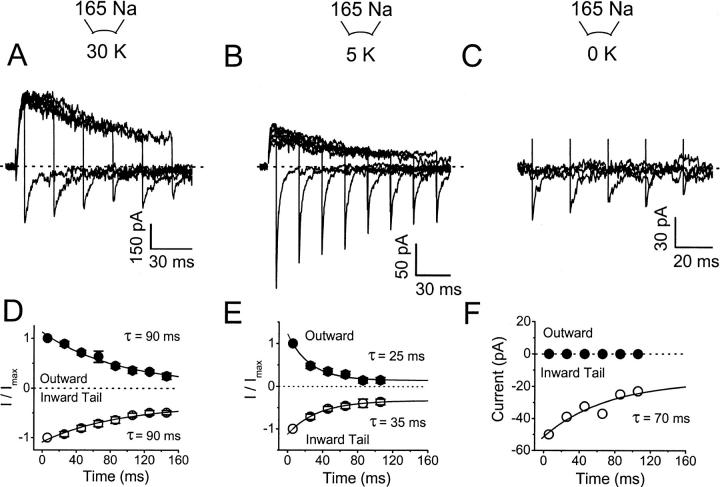
FIGURE 10.
The relative Na+ permeability of Kv4.1 channels is not altered during the development of inactivation. (A–C) Outward (K+) and inward (Na+) currents evoked by a step depolarization to +50 mV followed by hyperpolarizing step to −140 mV, from a holding potential of −100 mV. The duration of the depolarizing pulse is increased in 20-ms increments. The intracellular solutions (Materials and Methods) contained 30 mM KCl (A), 5 mM (B), and 0 KCl (C) (no added KCl). (D)–(F) Normalized outward (at the end of the depolarizing pulse) and inward tail currents (peaks) are plotted against the duration of the depolarizing pulse. Lines represent the best-fit exponential functions with the time constants indicated in the graphs. The symbols are mean values of six to seven experiments (except F, which is the result of a representative experiment; see text).

