
FIGURE 4.
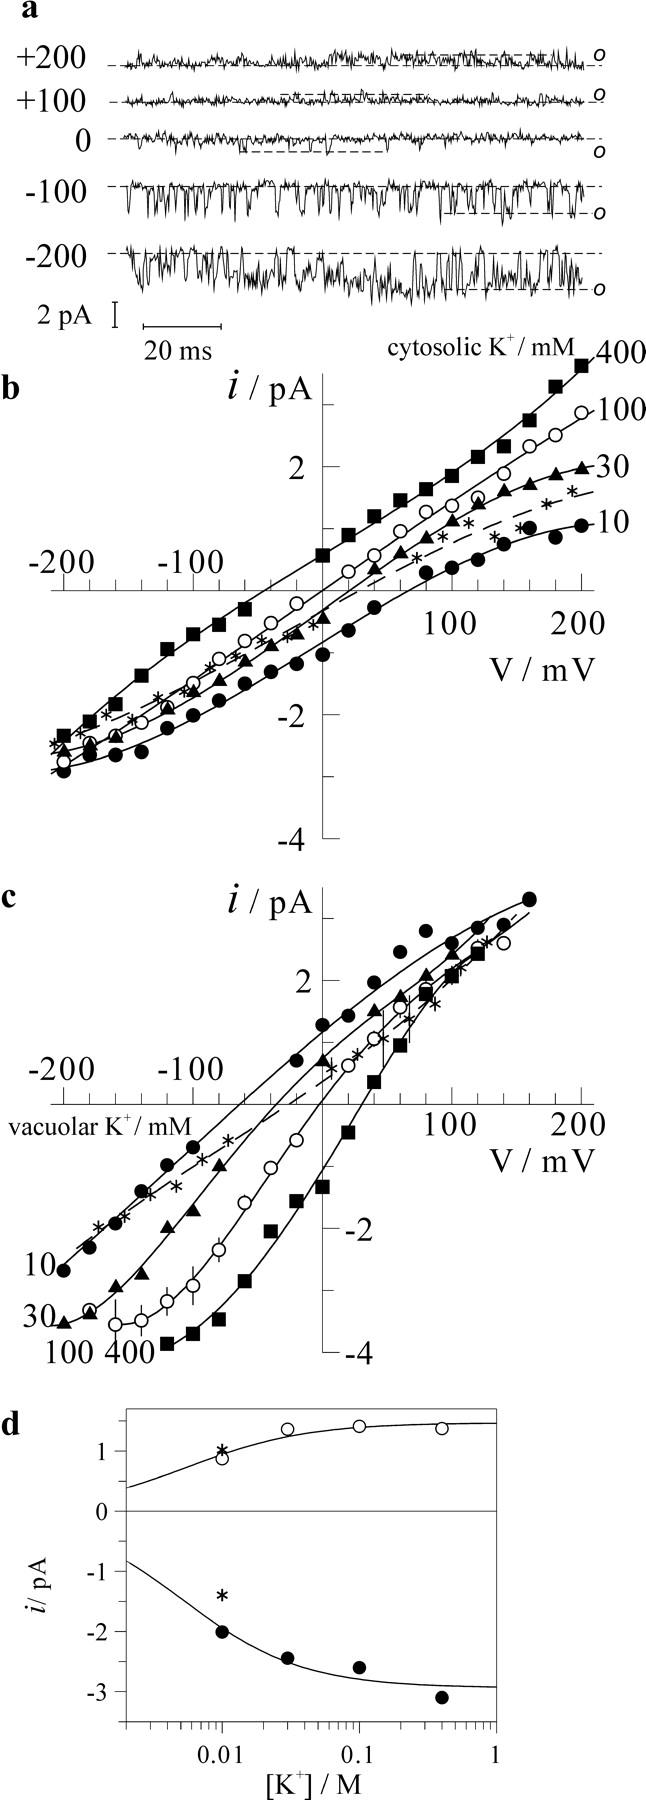
Effect of cytosolic and vacuolar K+ on single-channel current-voltage relations. (a) Example of single-channel recording on a tiny cytosolic side-out patch bathed in 10-mM K+ solution; patch pipette was filled with 100-mM K+ solution. Traces were filtered at 1 kHz. Open channel level is indicated by o, dashed line is the baseline corresponding to the closed channel level. (b) Single-channel current amplitudes as a function of membrane voltage were measured in experiments as one presented (a). Pipette (vacuolar side) was filled with 100-mM K+ solution; cytosolic side was bathed in solutions with variable K+ as indicated (in mM); asterisks are data obtained in 10-mM K+ plus 90-mM NMDG+ solution. (c) Single-channel current-voltage relationships for vacuolar side-out patches. Pipette (cytosolic side) was filled with 100-mM K+ solution, vacuolar K+ concentrations (in mM) are indicated. For symmetric 100 mM K+, n = 5 patches were analyzed and data are presented as mean ± SD. Those include also controls for two separate experiments where 10 mM K+ supplemented by 90-NMDG+ solution was tested (asterisks). (d) Single-channel current at potential 100 mV above (cytosolic side-out patch, hollow symbols) or below (vacuolar side-out patches, filled symbols) the reversal potential for single FV channel current as a function of cytosolic or vacuolar K+. Data were fitted to Michaelis-Menten equation with dissociation constant values given in the text. Points for 10 mM K+ supplemented by 90-mM NMDG+ solution (asterisks) are given for the comparison.