
FIGURE 6.
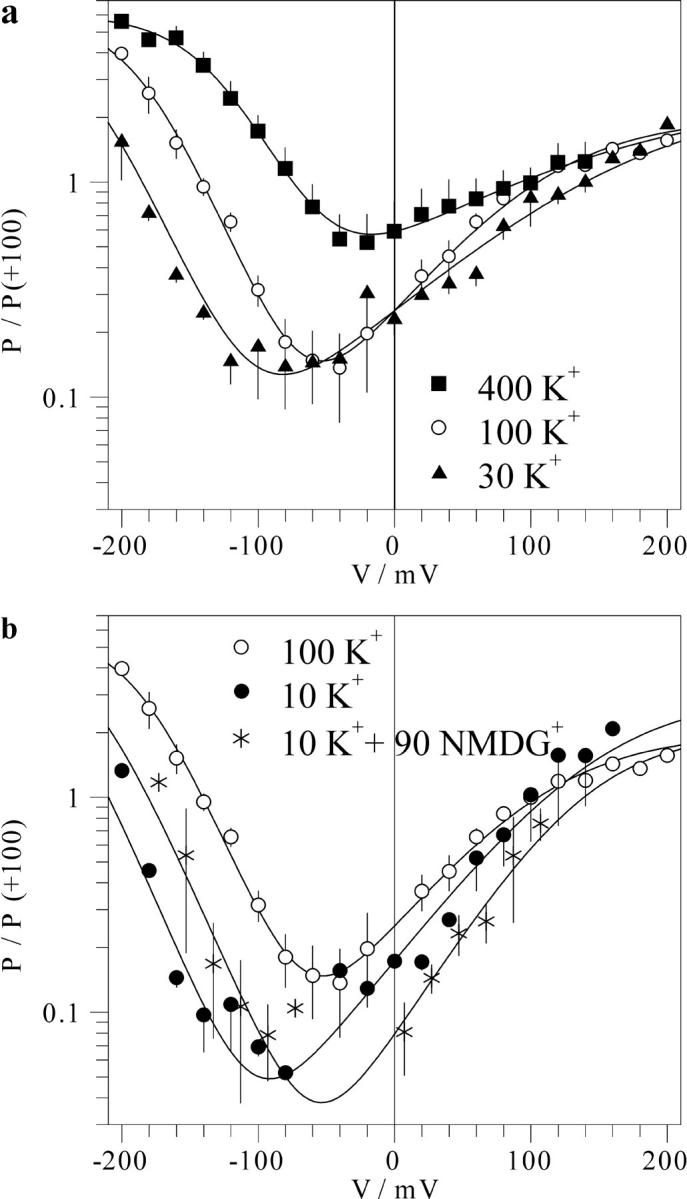
Effect of the vacuolar K+ on the voltage dependence of the FV channel. Mean number of open FV channels (in relative units) at different vacuolar K+ concentrations and 100 mM K+ in the pipette (cytosolic side) as a function of membrane voltage were obtained as described in the Fig. 5 legend. The data for each vacuolar K+ concentration obtained on n separate patches are averaged and presented as mean ± SD as a function of voltage. Symbols for different vacuolar K+ concentrations: 10 mM (filled circles, n = 3), 30 mM (triangles, n = 3), 100 mM (hollow circles, n = 6), and 400 mM (squares, n = 4); 10 mM K+ plus 90 mM NMDG+ (asterisks, n = 2). Solid lines are best fits to Eq. 1, with values of parameters V1 and V2 plotted in Fig. 7 b.