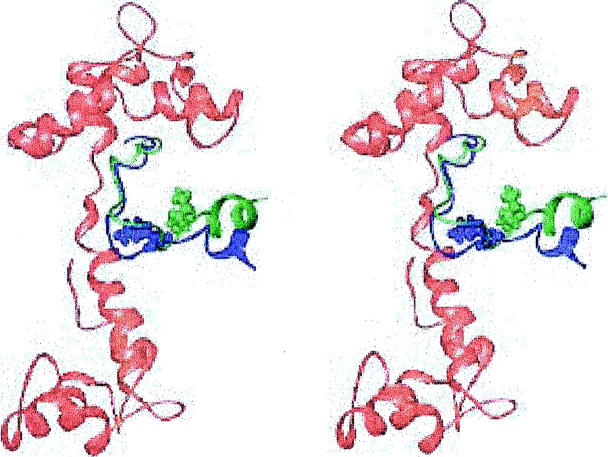
FIGURE 4.
Stereoview of the lowest energy cTnI model with the regulatory region located near the cTnC central helix (blue). This structure was generated using g homology model orientation for cTnC. Also shown is the cTnI conformation from another member of this family (green). cTnI 139 is space filling in both conformations. cTnC is shown in red. Generated with Ribbons (Carson, 1998).

