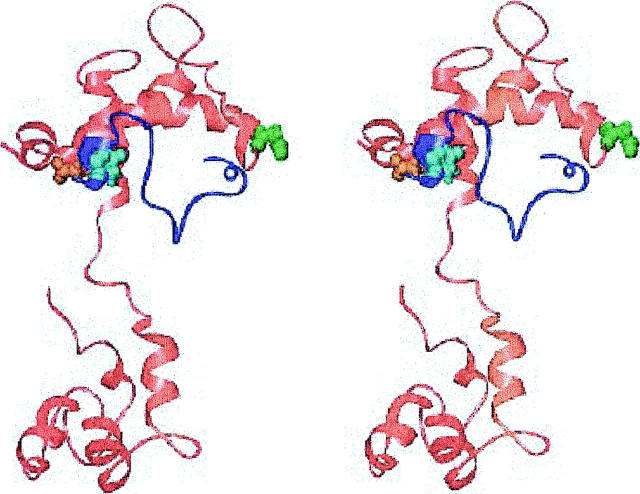
FIGURE 5.
Stereoview of the lowest energy structure with the inhibitory region of cTnI located near the cTnC N-terminus, and the homology orientation for cTnC. cTnC is in red, cTnI in dark blue. cTnC 51 is space filling and green, cTnC 15 is space filling and orange, cTnI 131 is space filling and cyan. Generated with Ribbons (Carson, 1998).

