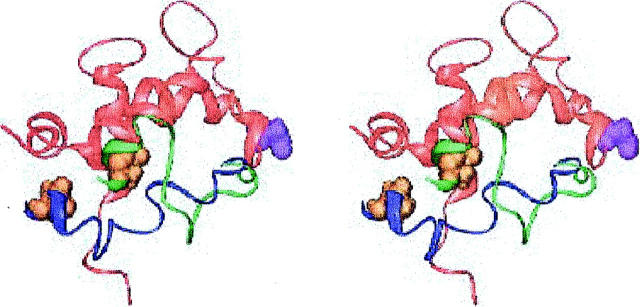
FIGURE 6.
Stereoview of the lowest energy cTnI 129-160 model with the inhibitory region of cTnI near the cTnC N-terminus, generated using a homology-based orientation of cTnI (cTnI in green). Also shown is a similar structure from the dipolar-coupling models (cTnI in dark blue). cTnI 131 is orange and space filling in both models. cTnC 1-94 is in red, with cTnC 51 space filling and violet. Generated with Ribbons (Carson, 1998).

