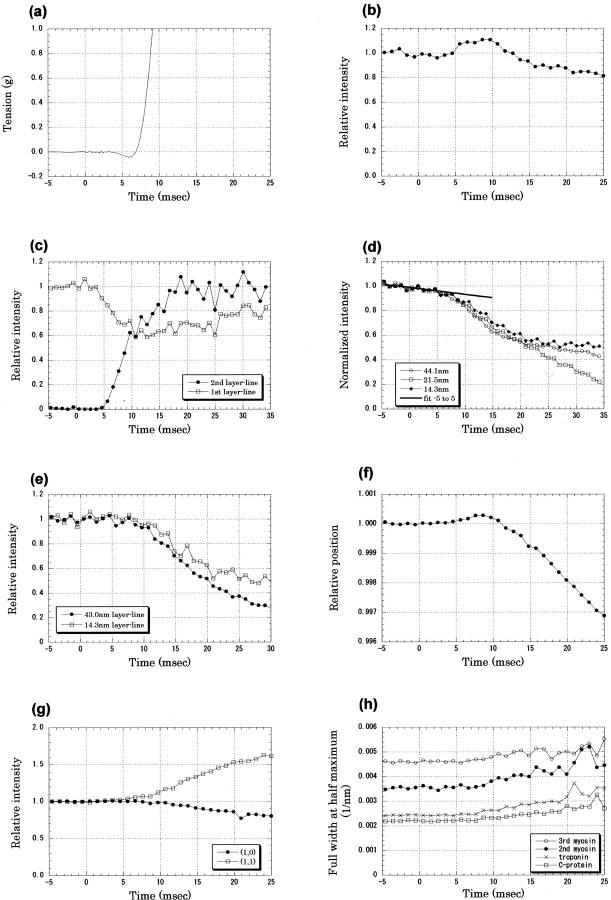
FIGURE 3.
Tension and x-ray diffraction intensities recorded in the early phase of twitch of frog sartorius muscle at 12°C. The x-ray data were recorded with a time resolution of 1.02 ms; results from 13 muscles, each of which was made to contract ∼10 times, were averaged. Intensity was normalized by an average of those before the stimulus. (A) Tension. A 1-ms stimulus was given at time 0. This trace is an average of 18 twitches of 9 muscles. (B) Intensity change of the troponin reflection at 1/38.5 nm−1 after an electrical stimulus at time 0. The averaged intensity before the stimulus was 54,000 photons. Mean ± SD (n = 12) <0.01 before the stimulus and <0.05 in 0–25 ms. (C) Intensity changes of the first and second actin layer lines at 1/36 and 1/18 nm−1, respectively. The intensity of the first layer line was normalized with that before the stimulus, whereas that of the second layer line was normalized by the intensity at 30–35 ms. The averaged intensity of the first layer line before the stimulus was 74,000 photons, and that of the second layer line at 30–35 ms was 59,000 photons. Mean ± SD (n = 11) for the second layer line, <0.01 both before the stimulus and in 0–25 ms; for the first layer line, <0.04 before the stimulus and <0.11 in 0–25 ms. (D) Intensity changes of the meridional reflections from the thick filament, a reflection from C-protein at 1/44.1 nm−1, the second myosin reflection at 1/21.5 nm−1, and the third myosin reflection at 1/14.3 nm−1. The line was fitted to the slow intensity decrease of the C-protein reflection between −5 and 5 ms. The averaged intensities before the stimulus were 130,000, 55,000, and 124,000 photons for the three reflections, respectively. Means ± SD (n = 12) for the three reflections were <0.01 before the stimulus and <0.04 in 0–25 ms. (E) Intensity changes of myosin layer lines: the first layer line at 1/43 nm−1 and the (1,0) sampling peak of the third layer line at 1/14.3 nm−1. The averaged intensities before the stimulus were 53,000 and 9000 photons for the first and third layer lines, respectively. Mean ± SD (n = 12) for the 43-nm layer line, <0.01 before the stimulus and <0.04 in 0–25 ms; for the 14.3-nm layer line, <0.03 before the stimulus and <0.05 in 0–25 ms. (F) The position of the third-order meridional reflection from the thick filament, which was calculated from the center of gravity of five data points around the peak. The distance from the direct beam was normalized by the value before the stimulus. An increase indicates a shift toward the higher angle. Mean ± SD (n = 12) <0.0003 before the stimulus and <0.0012 in 0–25 ms. (G) Intensity changes of the equatorial reflections: the (1,0) reflection and the (1,1) reflection. The averaged intensities before the stimulus were 432,000 and 198,000 photons for the (1,0) and (1,1) reflections, respectively. Mean ± SD (n = 12) for the (1,0) reflection, <0.001 before the stimulus and <0.06 in 0–25 ms; for the (1,1) reflection, <0.03 before the stimulus and <0.11 in 0–25 ms. (H) Lateral width (full width at half-maximum) of the meridional reflections: the third-order myosin reflection at 1/14.3 nm−1, the second-order myosin reflection at 1/21.5 nm−1, the troponin reflection at 1/38.5 nm−1, and the C-protein reflection at 1/44.1 nm−1. Mean ± SD (n = 12) for the 14.3-nm reflection, <0.0001 nm−1 before the stimulus and <0.0005 nm−1 in 0–25 ms; for the 21.5-nm reflection, <0.0001 nm−1 before the stimulus and <0.0006 nm−1 in 0–25 ms; for the 38.5-nm reflection, <0.00005 nm−1 before the stimulus and <0.0006 nm−1 in 0–25 ms; and for the 44.1-nm reflection, <0.00004 nm−1 before the stimulus and <0.0005 nm−1 in 0–25 ms.

