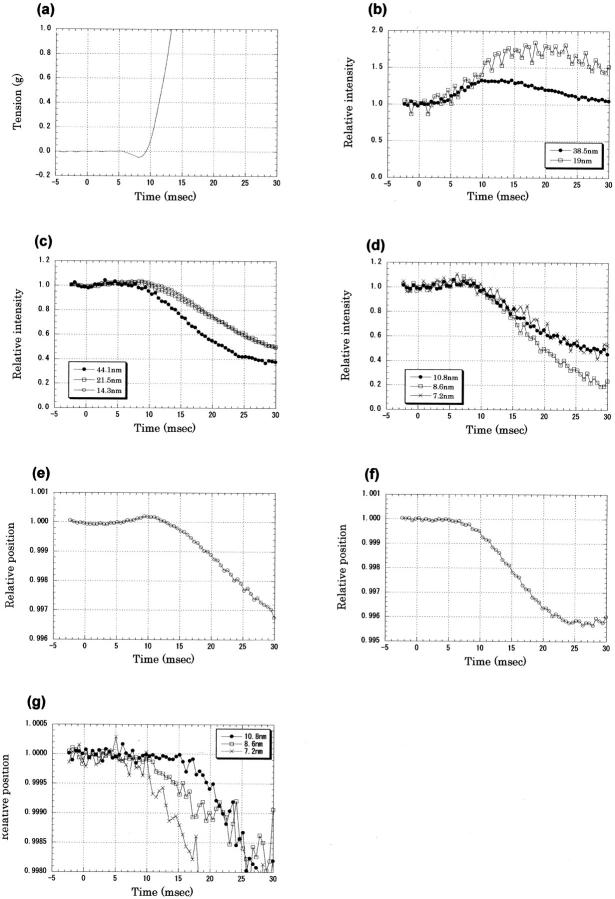
FIGURE 4.
Tension and x-ray diffraction intensities recorded in the early phase of twitch of frog sartorius muscles at 8°C. The x-ray data were recorded with a time resolution of 0.53 ms from 13 muscles, each of which was contracted 6–10 times. The intensity was normalized by the average of data points before the stimulus. (A) Tension recording in the early phase of twitch of frog sartorius muscles at 8°C. A 1-ms stimulus was given at time 0. This is an average of 28 contractions of 14 muscles. (B) Intensity changes of the first and second troponin reflections at 1/38.5 and 1/19 nm−1 after an electrical stimulus at time 0. The averaged intensity before the stimulus was 160,000 for the first-order and 2000 photons for the second-order reflections. Mean ± SD (n = 14) for the 38.5-nm reflection, <0.06 both before the stimulus and in 0–30 ms; for the 19-nm reflection, <0.06 before the stimulus and <0.24 in 0–30 ms. (C) Intensity changes of the meridional reflections from the thick filament: a reflection from C-protein at 1/44.1 nm−1, the second-order myosin reflection at 1/21.5 nm−1, and the third-order myosin reflection at 1/14.3 nm−1. The averaged intensities before the stimulus were 346,000, 180,000 and 372,000 photons for the three reflections, respectively. Mean ± SD (n = 14) for the C-protein reflection was <0.01 before the stimulus and <0.05 in 0–30 ms; for the second- and third-order myosin reflections, <0.01 before the stimulus and <0.04 in 0–30 ms. (D) Intensity changes of the higher-order meridional reflections from the thick filament: the fourth-order myosin reflection at 1/10.8 nm−1, the fifth-order myosin reflection at 1/8.6 nm−1, and the sixth-order myosin reflection at 1/7.2 nm−1. The averaged intensities before the stimulus were 29,000, 33,000, and 1,2000 photons for the three reflections, respectively. Mean ± SD (n = 14) for the fourth-order reflection, <0.01 before the stimulus and <0.04 in 0–30 ms; for the fifth-order reflection, <0.02 before the stimulus and <0.06 in 0–30 ms; and for the sixth-order reflection, <0.05 before the stimulus and <0.12 in 0–30 ms. (E) The position of the third-order meridional reflection from the thick filament, which was calculated from the center of gravity of five data points around the peak. The distance from the direct beam, normalized by the resting value, is plotted. An increase indicates a shift toward the higher angle. Mean ± SD (n = 14) <0.00003 before the stimulus and <0.0002 in 0–30 ms. (F) The position of the second-order meridional reflection from the thick filament, which was calculated from the center of gravity of five data points around the peak. Mean ± SD (n = 14) <0.00009 before the stimulus and <0.0002 in 0–30 ms. (G) The positions of the fourth- (10.8 nm), fifth- (8.6 nm), and sixth- (7.2 nm) order meridional reflections from the thick filament, which were calculated from the center of gravity of five data points around the peak. Mean ± SD (n = 14) for the fourth-order reflection, <0.0001 before the stimulus and <0.0003 in 0–30 ms; for the fifth-order reflection, <0.00004 before the stimulus and <0.0003 in 0–30 ms; and for the sixth-order reflection, <0.0002 before the stimulus and <0.0010 in 0–30 ms.

