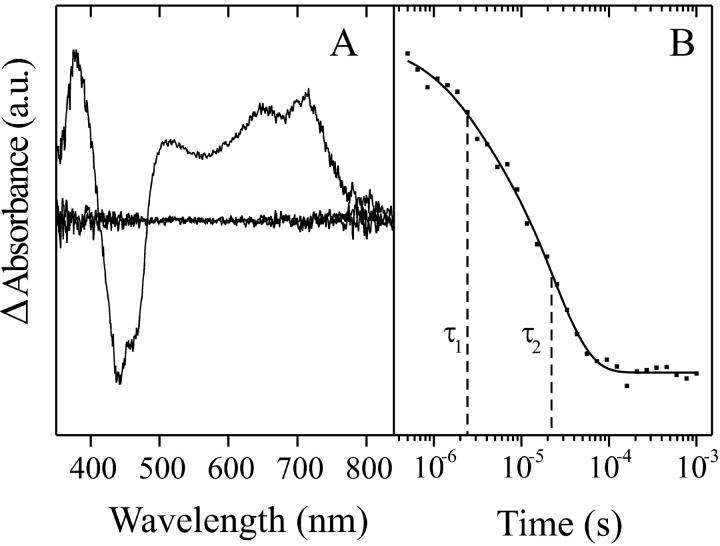
FIGURE 6.
Singular value decomposition and exponential fitting of the time-resolved absorbance changes of the LOV1-C57S mutant. Panel A depicts the three most significant spectral components. The time trace of the spectral component LOV1-715 is shown in panel B along with the fitted sum of two exponentials. The resulting time constants are indicated by dashed vertical lines (τ1 = 2 μs and τ2 = 23 μs, with relative amplitudes of 20% and 80% respectively).

