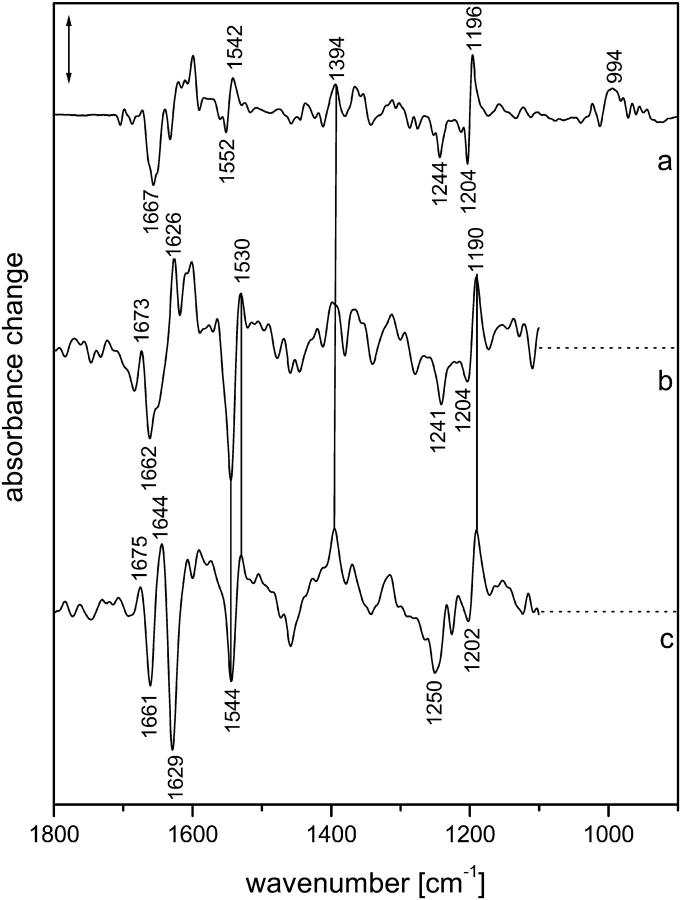
FIGURE 3.
Comparison of (a) the low-temperature KNpSRII spectrum obtained at 103 K with H2O, and the time-resolved KNpSRII spectra obtained at 37°C, averaged over 30–100 ns with (b) H2O or (c) 2H2O. Spectral resolution, 4 cm−1 (a) or 8 cm−1 (b) and (c). Owing to the large noise below 1100 cm−1, this spectral range was omitted in (b) and (c).

