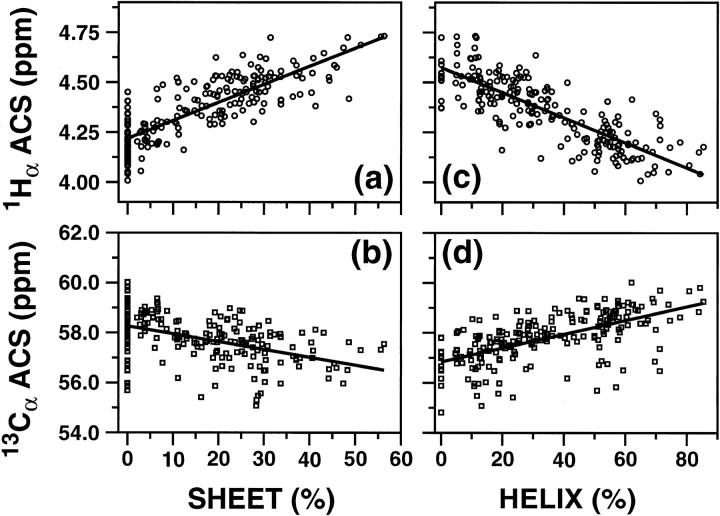
FIGURE 2.
Plots of ACS values versus the secondary structure contents estimated from the three-dimensional structures using the program PROMOTIF. (a) and (b) show the correlation 1Hα and 13Cα ACS values, respectively, to the percentage of β-sheet structures, whereas (c) and (d) correlate the same ACS values with respect to the percentage of helical structure (sum of α and 310 helices). Results of the linear regression analysis are shown by continuous lines.

