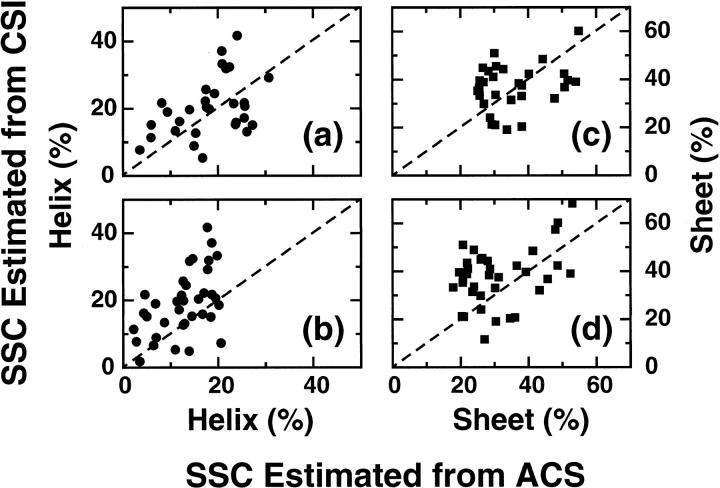
FIGURE 3.
Comparison of helical and sheet content percent calculated using 1Hα or 1HN ACS values to that obtained using a consensus chemical shift index-based method for a set of proteins for which no three-dimensional structures are available. (a) and (b) correspond to the helical content using the 1Hα and 1HN ACS values, respectively, whereas (c) and (d) are the corresponding sheet content using the same ACS values. The dashed lines correspond to a perfect correlation between these two methods.

