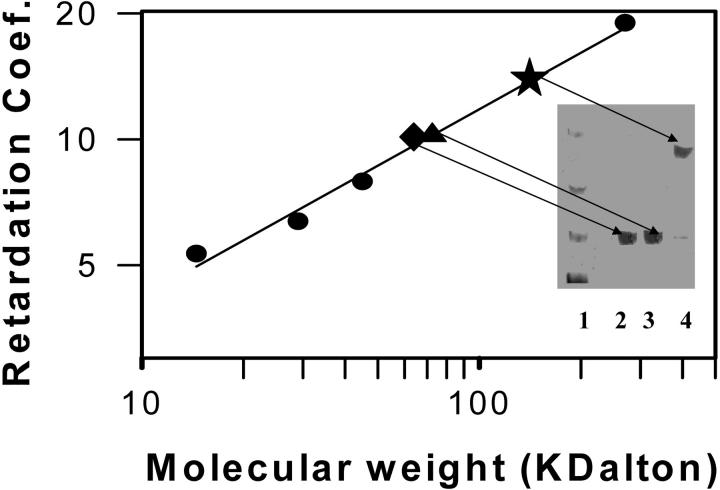
FIGURE 7.
Factor Xa was analyzed by native polyacrylamide gel electrophoresis in buffer A plus 5 mM CaCl2 as described in Methods. Retardation coefficient for different reference proteins were obtained from plots of log Rf versus percent cross-linking (5%, 6%, 8%, and 10%). A log-log plot of retardation coefficient is shown for these reference proteins (closed circles). Points have been added to this plot for retardation coefficients obtained for 100 nM factor Xa with 5 mM Ca2+ in the absence (closed triangle) or presence (closed star) of 400 μM C6PS and also with 2 mM Ca2+ and 400 μM C6PS (closed diamond). The inset shows lanes from the 7% gel (lane 1—markers, lane 2—100 nM Xa with 2 mM calcium and 400 μM C6PS, lane 3—100 nM Xa with 5 mM Ca2+ without C6PS, lane 4—100 nM Xa with 5 mM Ca2+ and 400 μM C6PS) with bands noted by arrows from the points on the Ferguson plot (Ferguson, 1964).

