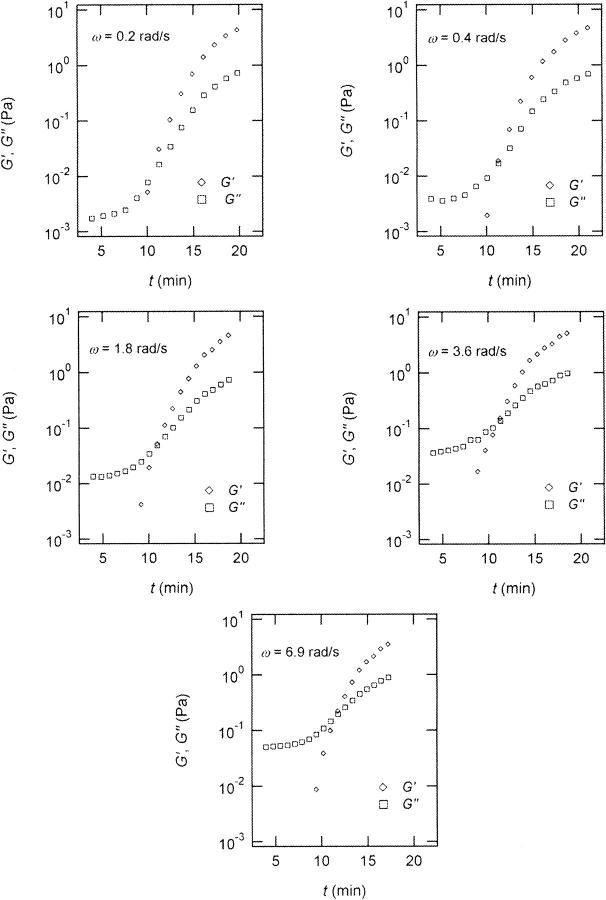
FIGURE 2.
Time dependence of the viscoelastic moduli  and
and  (c = 1.7 mg/ml) during gelation at T = 12°C recorded for five different frequencies. The point where
  and
and  intersect is shifted to later times with increasing frequency. For higher frequencies nonvanishing values of
  occur at earlier times than for lower frequencies.

