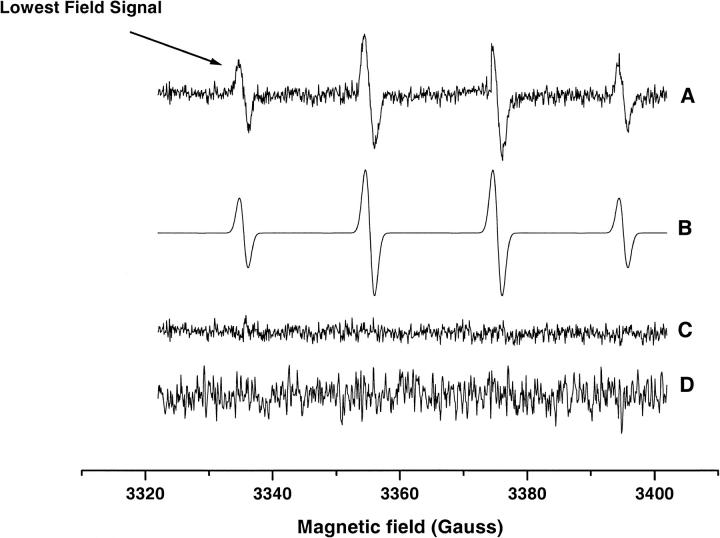
FIGURE 6.
(A) The EPR spectrum of the DMPO-OH adduct obtained from cell suspensions of WT and ρ0 Molt-4 cells treated with 400 μM MSB and 50mM DMPO. The lowest field signal was used to measure the change in the adduct intensity over time. (B) Simulation; (C) The residual signal obtained by subtracting the experimental spectrum from the simulated spectrum; (D) The spectrum obtained from ρ0 Molt-4 cells pretreated with 2 mM PCMB or WT Molt-4 cells pretreated with 2 mM KCN/PCMB. The high noise in this spectrum is due to high receiver gain used to record this spectrum.

