
FIGURE 1.
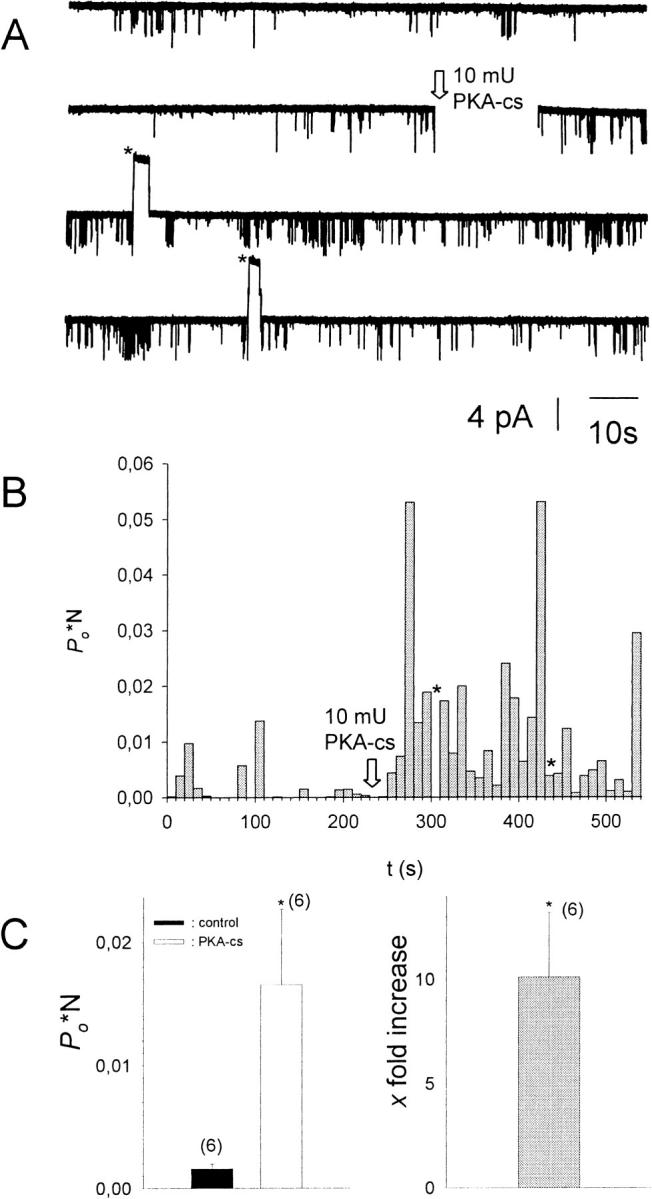
Addition of PKA-cs to the cytosolic solution results in an increase of Po*N. (A) Current recorded from a multichannel i.o. patch at −80 mV (N = 3). 10−5 M acetylcholine was present in the pipette solution, 1 mM ATP, and 0.1 mM GTP in the bath solution. Channel openings are represented by downward deflections of the current trace at −80 mV. The arrow indicates addition of 20 mU/ml PKA-cs to the (intracellular) bath solution (total bath volume was 500 μl). Asterisks signify time spans when the membrane potential was switched to +80 mV to test for inward rectification of channel openings. (B) Po*N, calculated for 10-s intervals, versus time, shown for the entire current trace visible in A. (C, left) Average Po*N before (control) and after addition of 20 mU/ml PKA-cs (PKA-cs), obtained from six different patches. (C, right) Average increase in Po*N upon addition of PKA-cs (n = 6). *, The change in Po*N compared to control conditions is statistically significant at the p < 0.05 level.