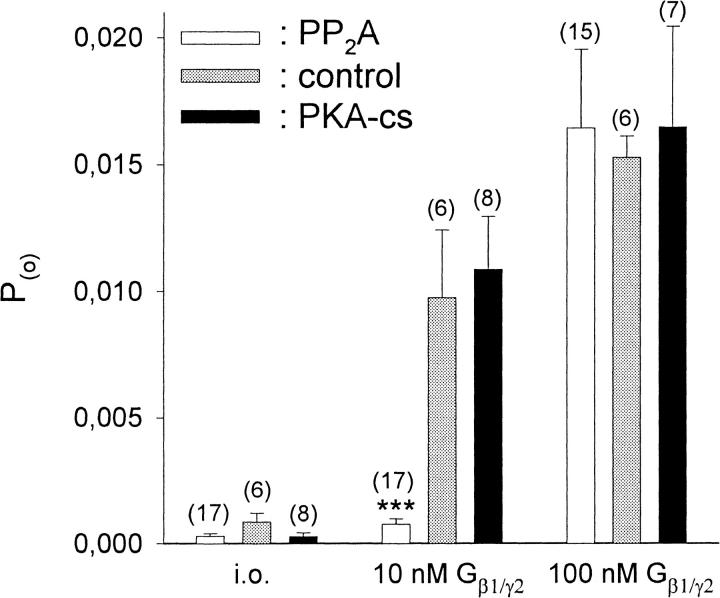
FIGURE 3.
Channel activity (Po) at different concentrations of Gβ1/γ2 for patches treated with PP2A, PKA-cs, or no enzyme added. Number of experiments (n) is given in parentheses above each bar. Number of channels in the patch (N ≥ 1). ***, The average Po for PP2A-treated patches deviates significantly at the p < 0.001 level from Po in patches treated with PKA-cs.

