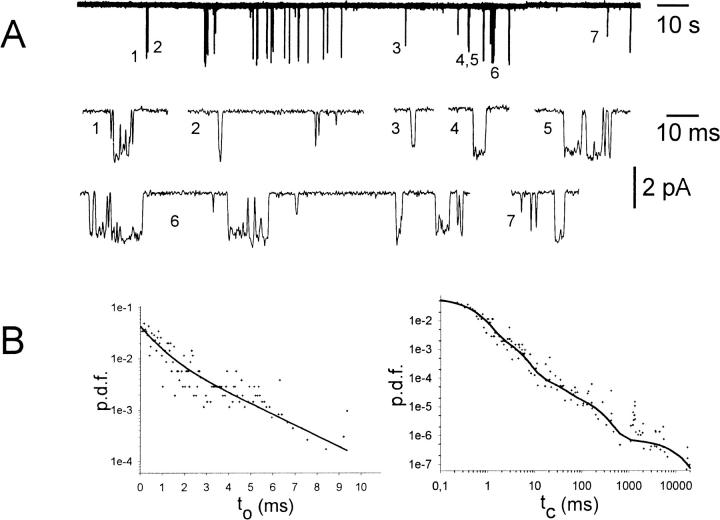
FIGURE 6.
Single channel trace recorded from an inside-out patch treated with PP2A and 10 nM Gβ1/γ2. (A, top) 200 s of history in the lifetime of a single GIRK1/GIRK4 channel, dephosphorylated by PP2A and activated by 10 nM Gβ1/γ2. (A, lower traces) Single and multiple openings of the current trace shown on top and shown below at expanded timescale. (B, left) Probability density function (p.d.f.) of open time distribution for the current trace shown in A. +, experimental data; (solid line), least square regression obtained by fitting the data to the sum of two exponentials. (B, right) The p.d.f. of closed time distribution. Data were fitted by the sum of five exponentials.

