FIGURE 7.
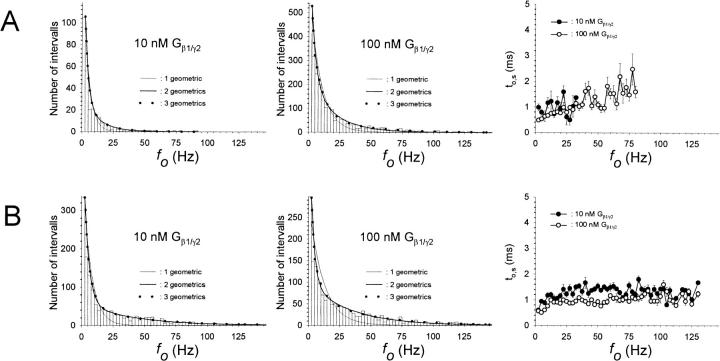
Modal gating of single phosphorylated/dephosphorylated GIRK1/GIRK4 channels. (A) Frequency distributions obtained from patches treated with PP2A at 10 nM Gβ1/γ2 (left) and at 100 nM Gβ1/γ2 (middle). Mean channel open time (to,s) as a function of fo is shown for both 10 nM and 100 nM Gβ1/γ2 (right). (B) Frequency distributions and distributions of to,s, but for patches treated with PKA-cs.

