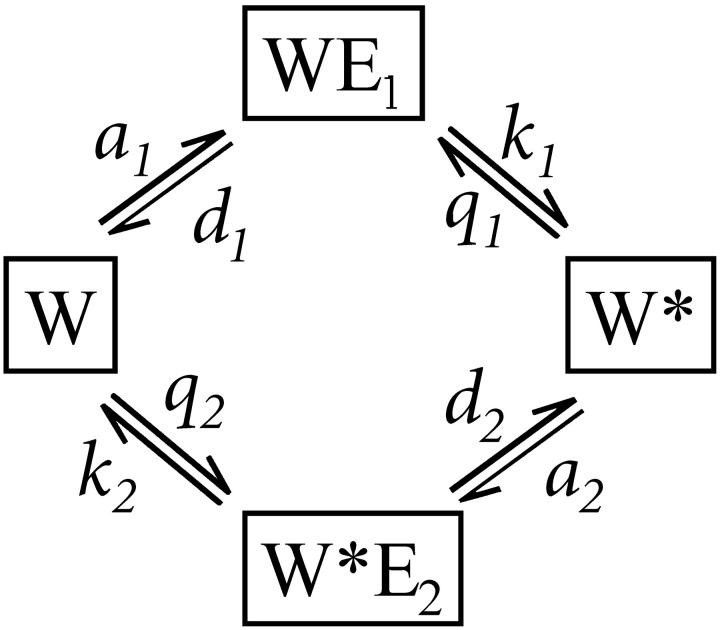
FIGURE 1.
A kinetic schematics for PdPC. E1 and E2 represent kinase and phosphatase. The substrate, protein W, is phosphorylated by the kinase to become W*, which in turn is dephosphorylated by E2. A complete reaction cycle hydrolyzes one  Hence,
  where
where  is the phosphorylation potential. Both enzymatic reactions are nearly irreversible:
  Let
Let  be the total substrate concentration neglecting the small amount of enzyme-substrate complexes, E1T and E2T the total enzyme concentrations for E1 and E2. Goldbeter and Koshland (1981) showed that the number of model parameters can be reduced, with nondimensionalization, to four key parameters:
  ,
,  are the Michaelis-Menten constants, and
  ,
,  are maximal velocities, for E1 and E2 respectively.
  is a measure of the strength of stimuli/inhibition. K1 and K2 are directly related to the affinity of the enzymes to their respective substrates.

