
FIGURE 8.
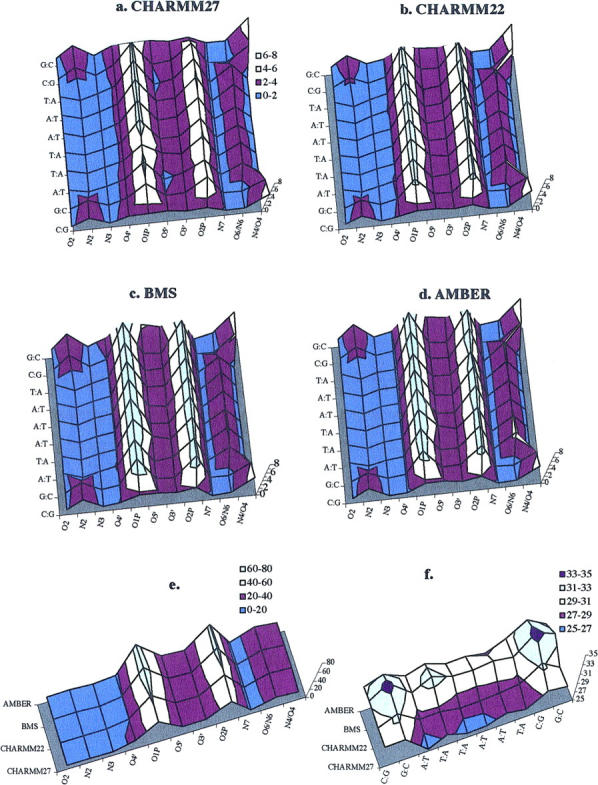
Diagram illustrating the number of water molecules in the hydration shells of individual oxygen and nitrogen atoms averaged over the DNA simulations for the different force fields: (a) CHARMM27, (b) CHARMM22, (c) BMS, (d) AMBER. The number of water molecules averaged over all atomic sites for all basepairs is shown in (e); the average number of water molecules at all atomic sites around each basepair is shown in (f). Water molecules are counted if they are less than 3.0 Å from the hydrogen-bonding partners in the DNA. Colors are used to make clearer the different basepair positions (from the first basepair at the bottom to the last one at the top).