
FIGURE 9.
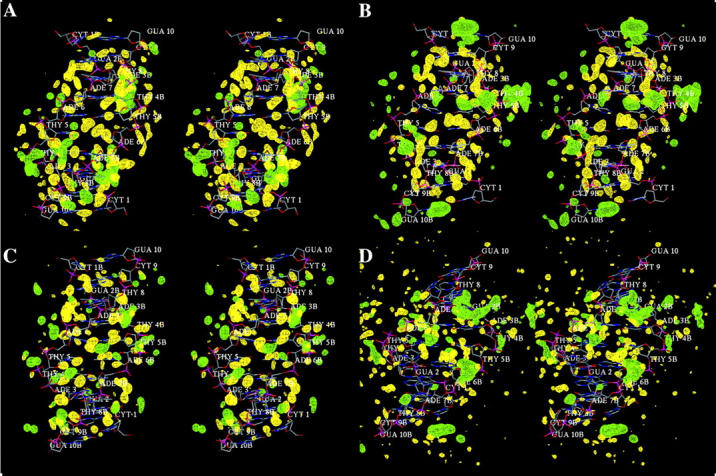
Wall-eyed stereo view of water and ion hydration patterns in the minor groove of B-DNA as obtained from the MD trajectories with (a) AMBER, (b) BMS, (c) CHARMM27, (d) CHARMM22. Density contours show water oxygen (yellow) and sodium ion (green) densities at level of 80 water molecules per nm3 and 10 ions per nm3 calculated from a grid with 0.25 Å resolution.