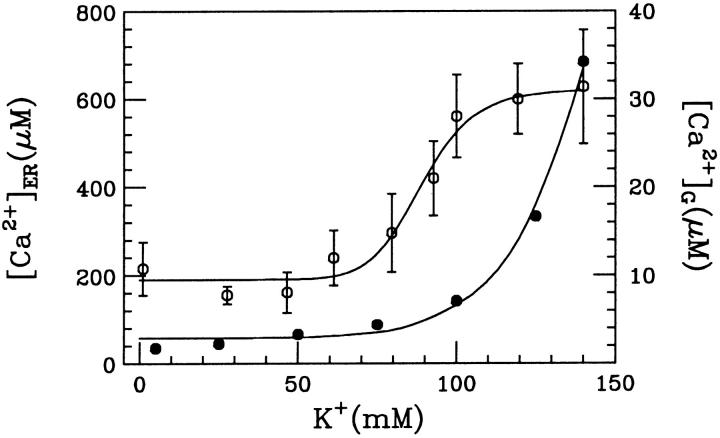
FIGURE 2.
Derivation of intraluminal Ca2+-K+ exchange parameters. Fit of data (Nguyen et al., 1998) to Eq. 5 is obtained by least-square method. Either plot ( filled circles, or
  open circles) is drawn by using the corresponding parameters specified in the text.

